

August carries a bad but undeserved reputation as the month when bad things happen to good people as well as a few not so good professional traders. I’ve come here to dispel that entire notion as August’s bad rep is entirely based on a few outliers which happen to stick out like a fistful of sore thumbs. Naturally that’s what everyone is focused on whilst completely dismissing the entire rest of the dataset.
But of course let’s not kid ourselves – August is not a great month to be an investor. First up it’s summer and everyone’s got better things to do than to watch candles and indicators hop around on a small digital screen. Or at least that’s how it used to be pre-COVID, but I digress…
Statistically speaking August is a coin toss with a teeny weeny bias toward the upside. As you can see downside corrections actually happen a lot more frequently in September but rarely do I hear people worry about that one.
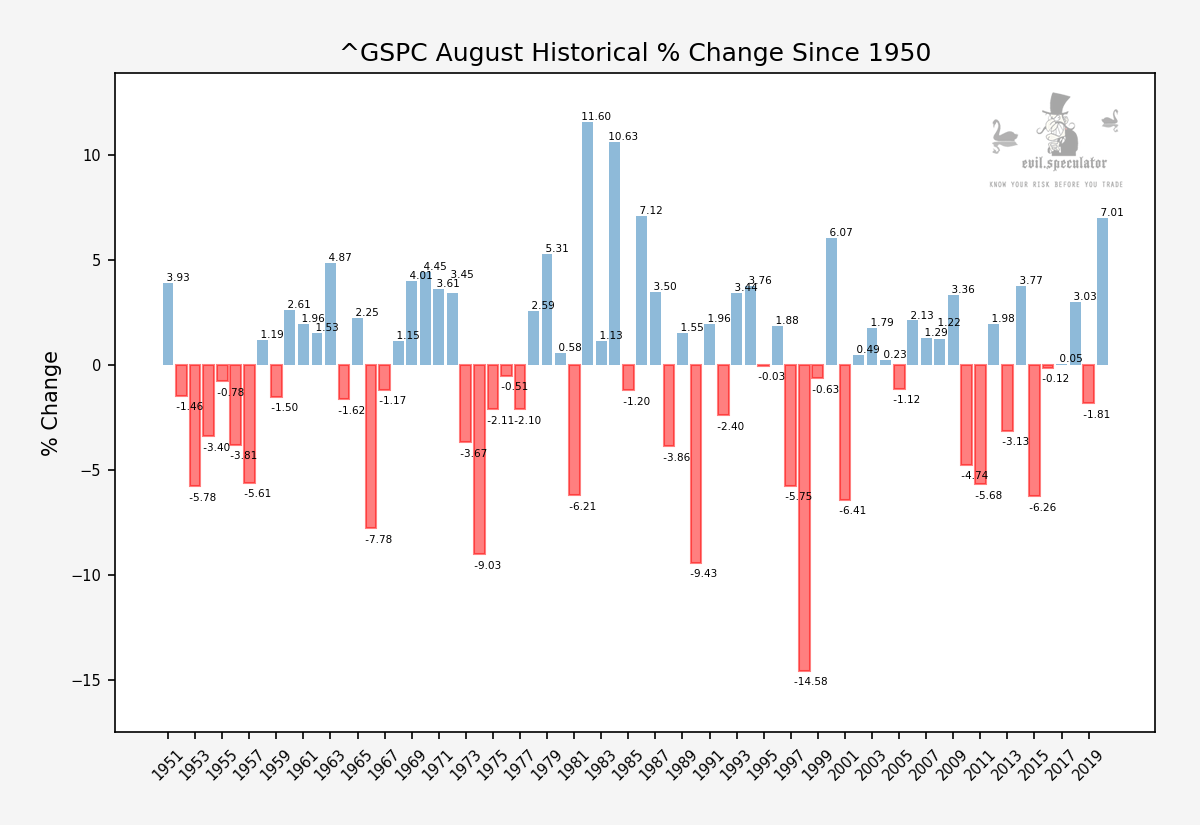
Which isn’t overly surprising because the majority of people see what they want to see and once their mind is made up they don’t dig any deeper. Plus the human eye is naturally drawn to outliers which can distort our perspective.
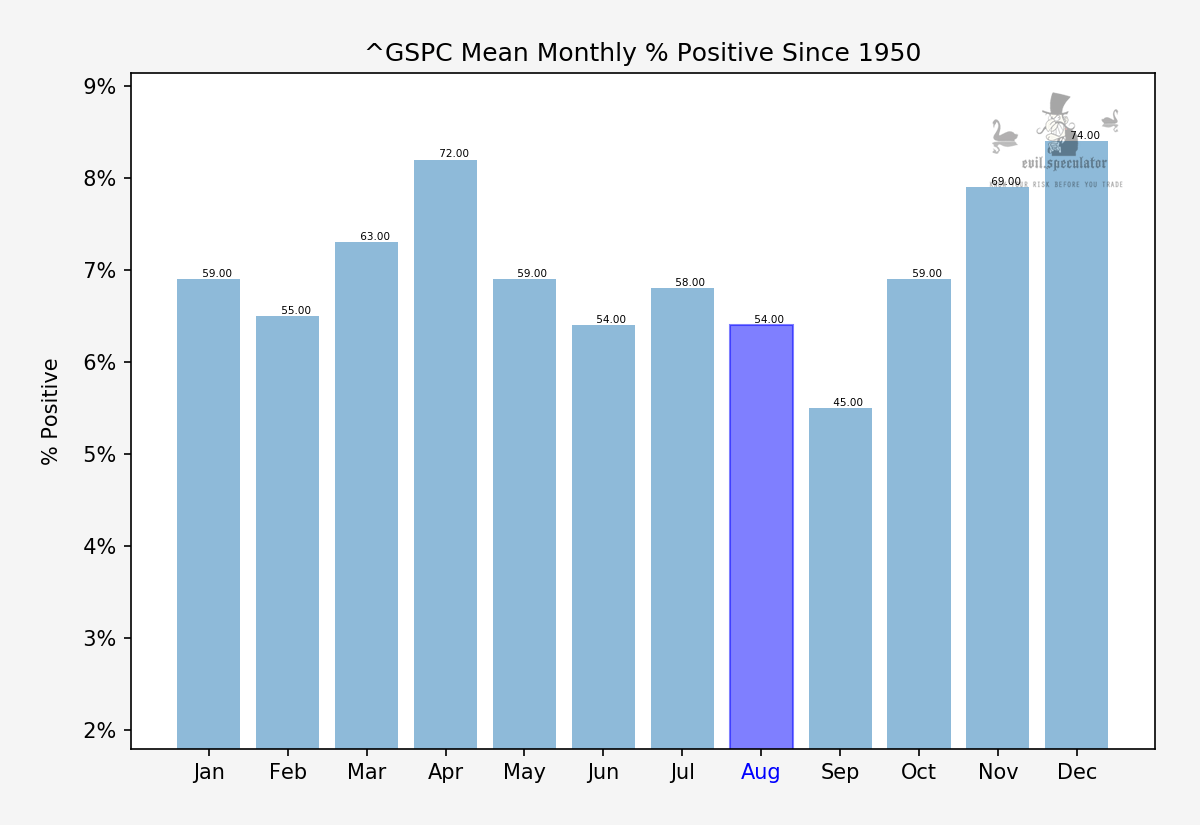
Many of you are probably surprised to learn that August actually has closed in the plus 54% of the time since 1950. Admittedly that’s pretty close to a coin toss but it’s not anywhere near the ‘crash magnet’ many make it out to be.
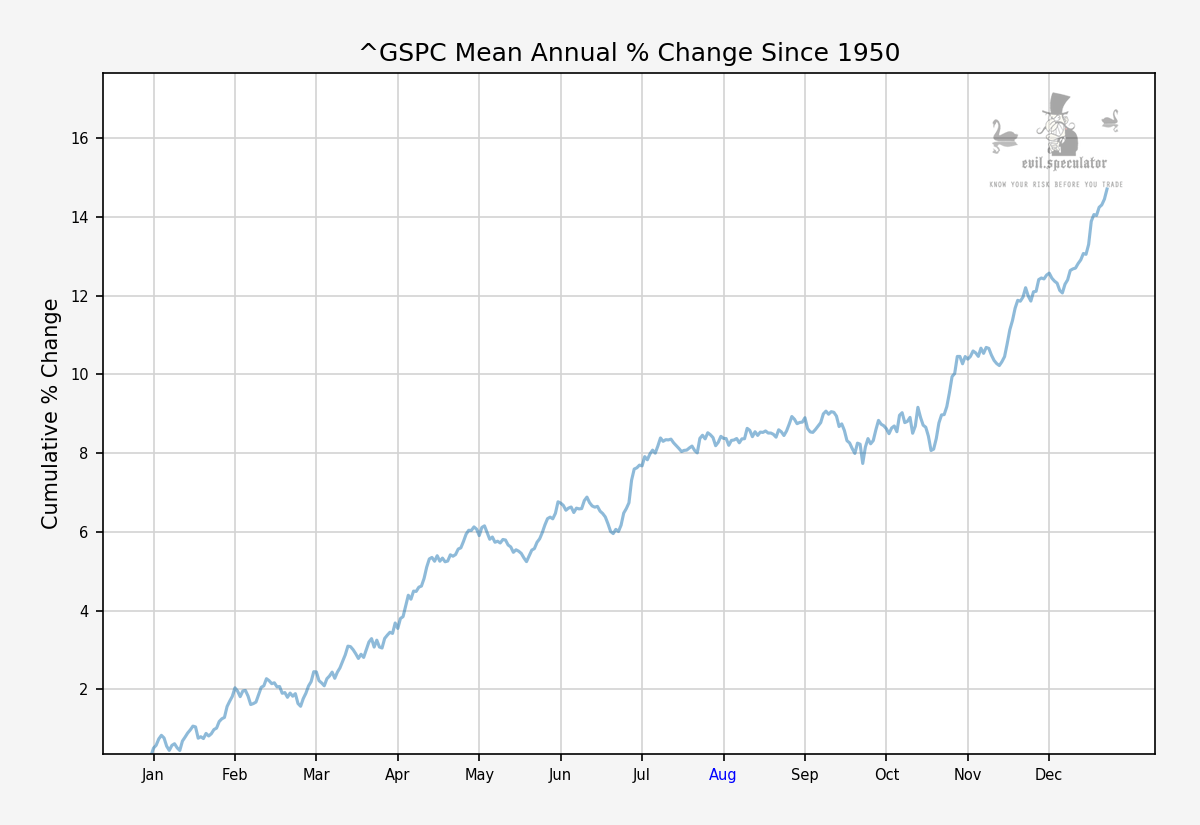
If you add all the years of daily price action together and then average them out you get the chart above. I don’t know about you but to me this looks like one big yawn fest – and that’s exactly what you should expect during the hottest month of the year (in the Northern hemisphere of course).
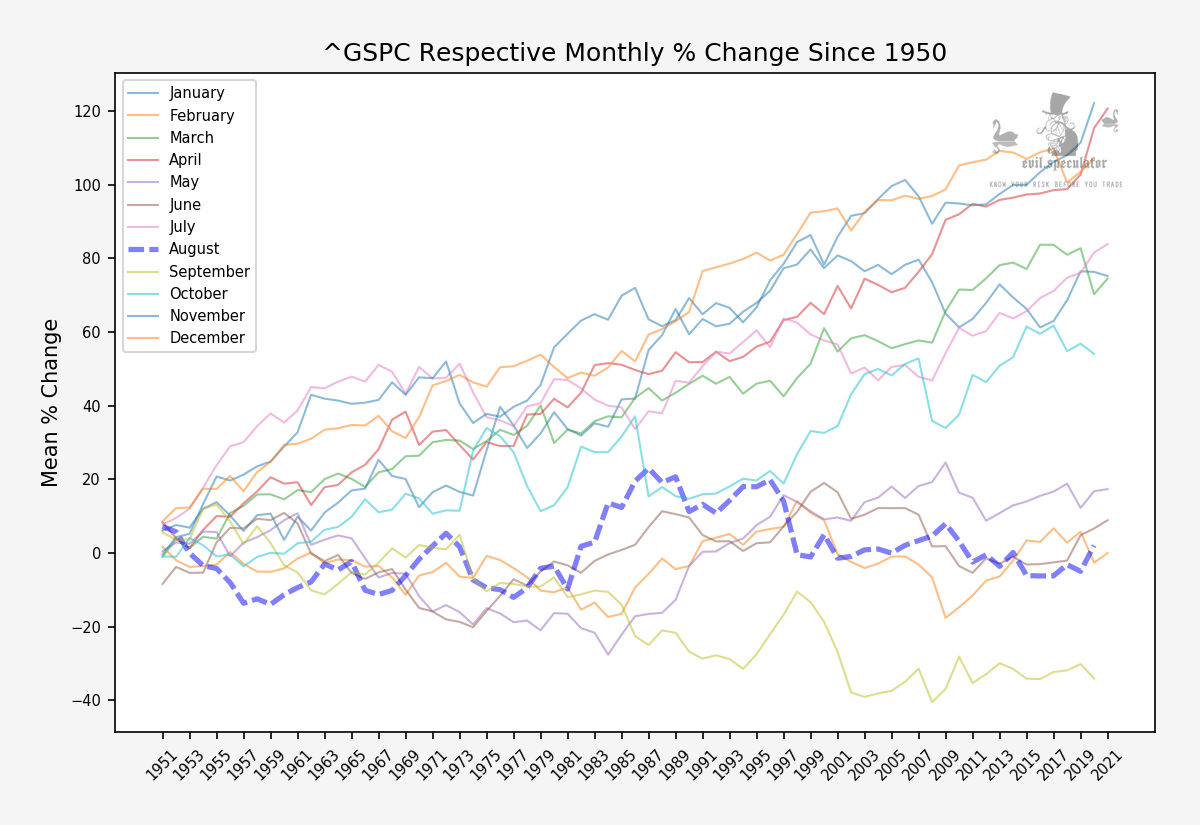
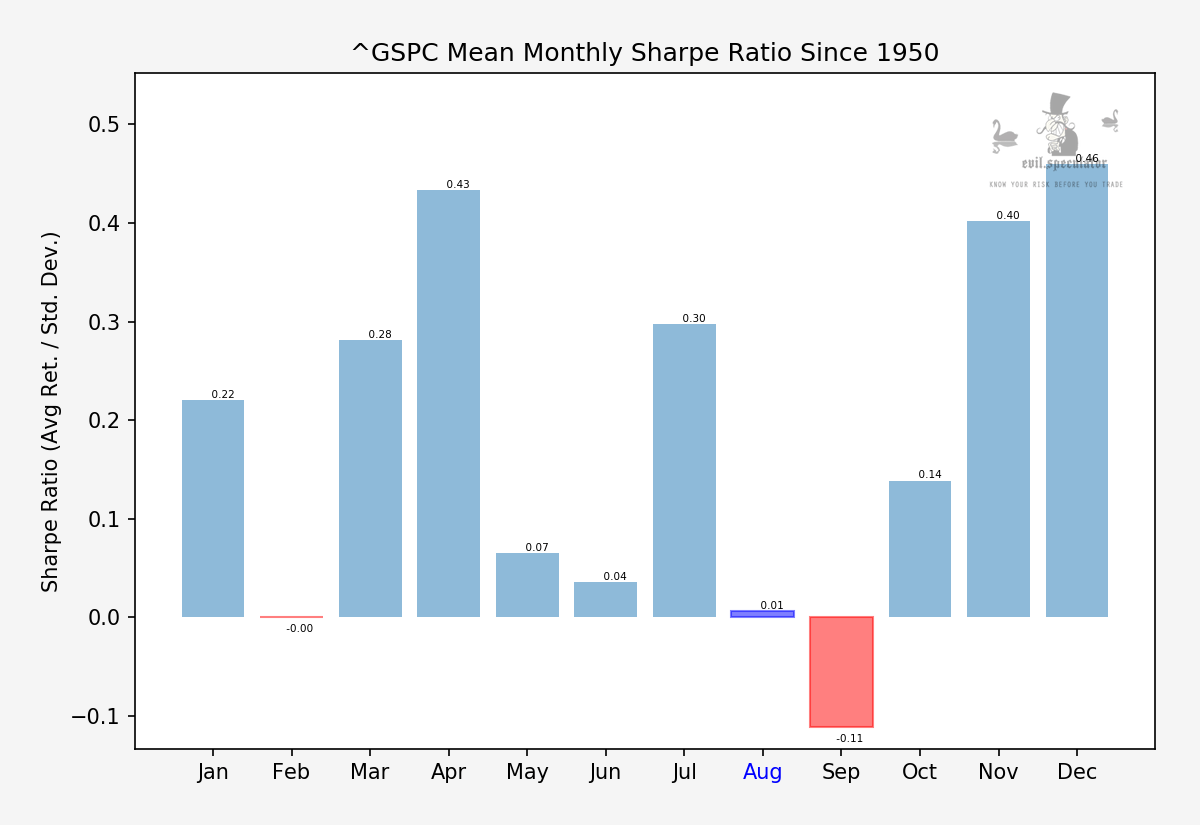
Compared with all other months August is in the second lowest quintile, so unless you are a swing trader it’s best just to sit it out and work on your tan.
Of course not all weeks of August are identical, so let’s drill down a bit deeper and see what awaits us over the next five sessions and the weeks beyond.
Continue reading this post over on Evil Speculator…
By the way, if you’re a statistics addict like me then sign up here for a FREE 2-week trail of our Evil Speculator Statistics Tool, instantly giving you access to comprehensive weekly and monthly statistics on thousands of stock symbols on the S&P 500, the Nasdaq, the Russell 2000, the Dow Jones Industrial Index, and more.
