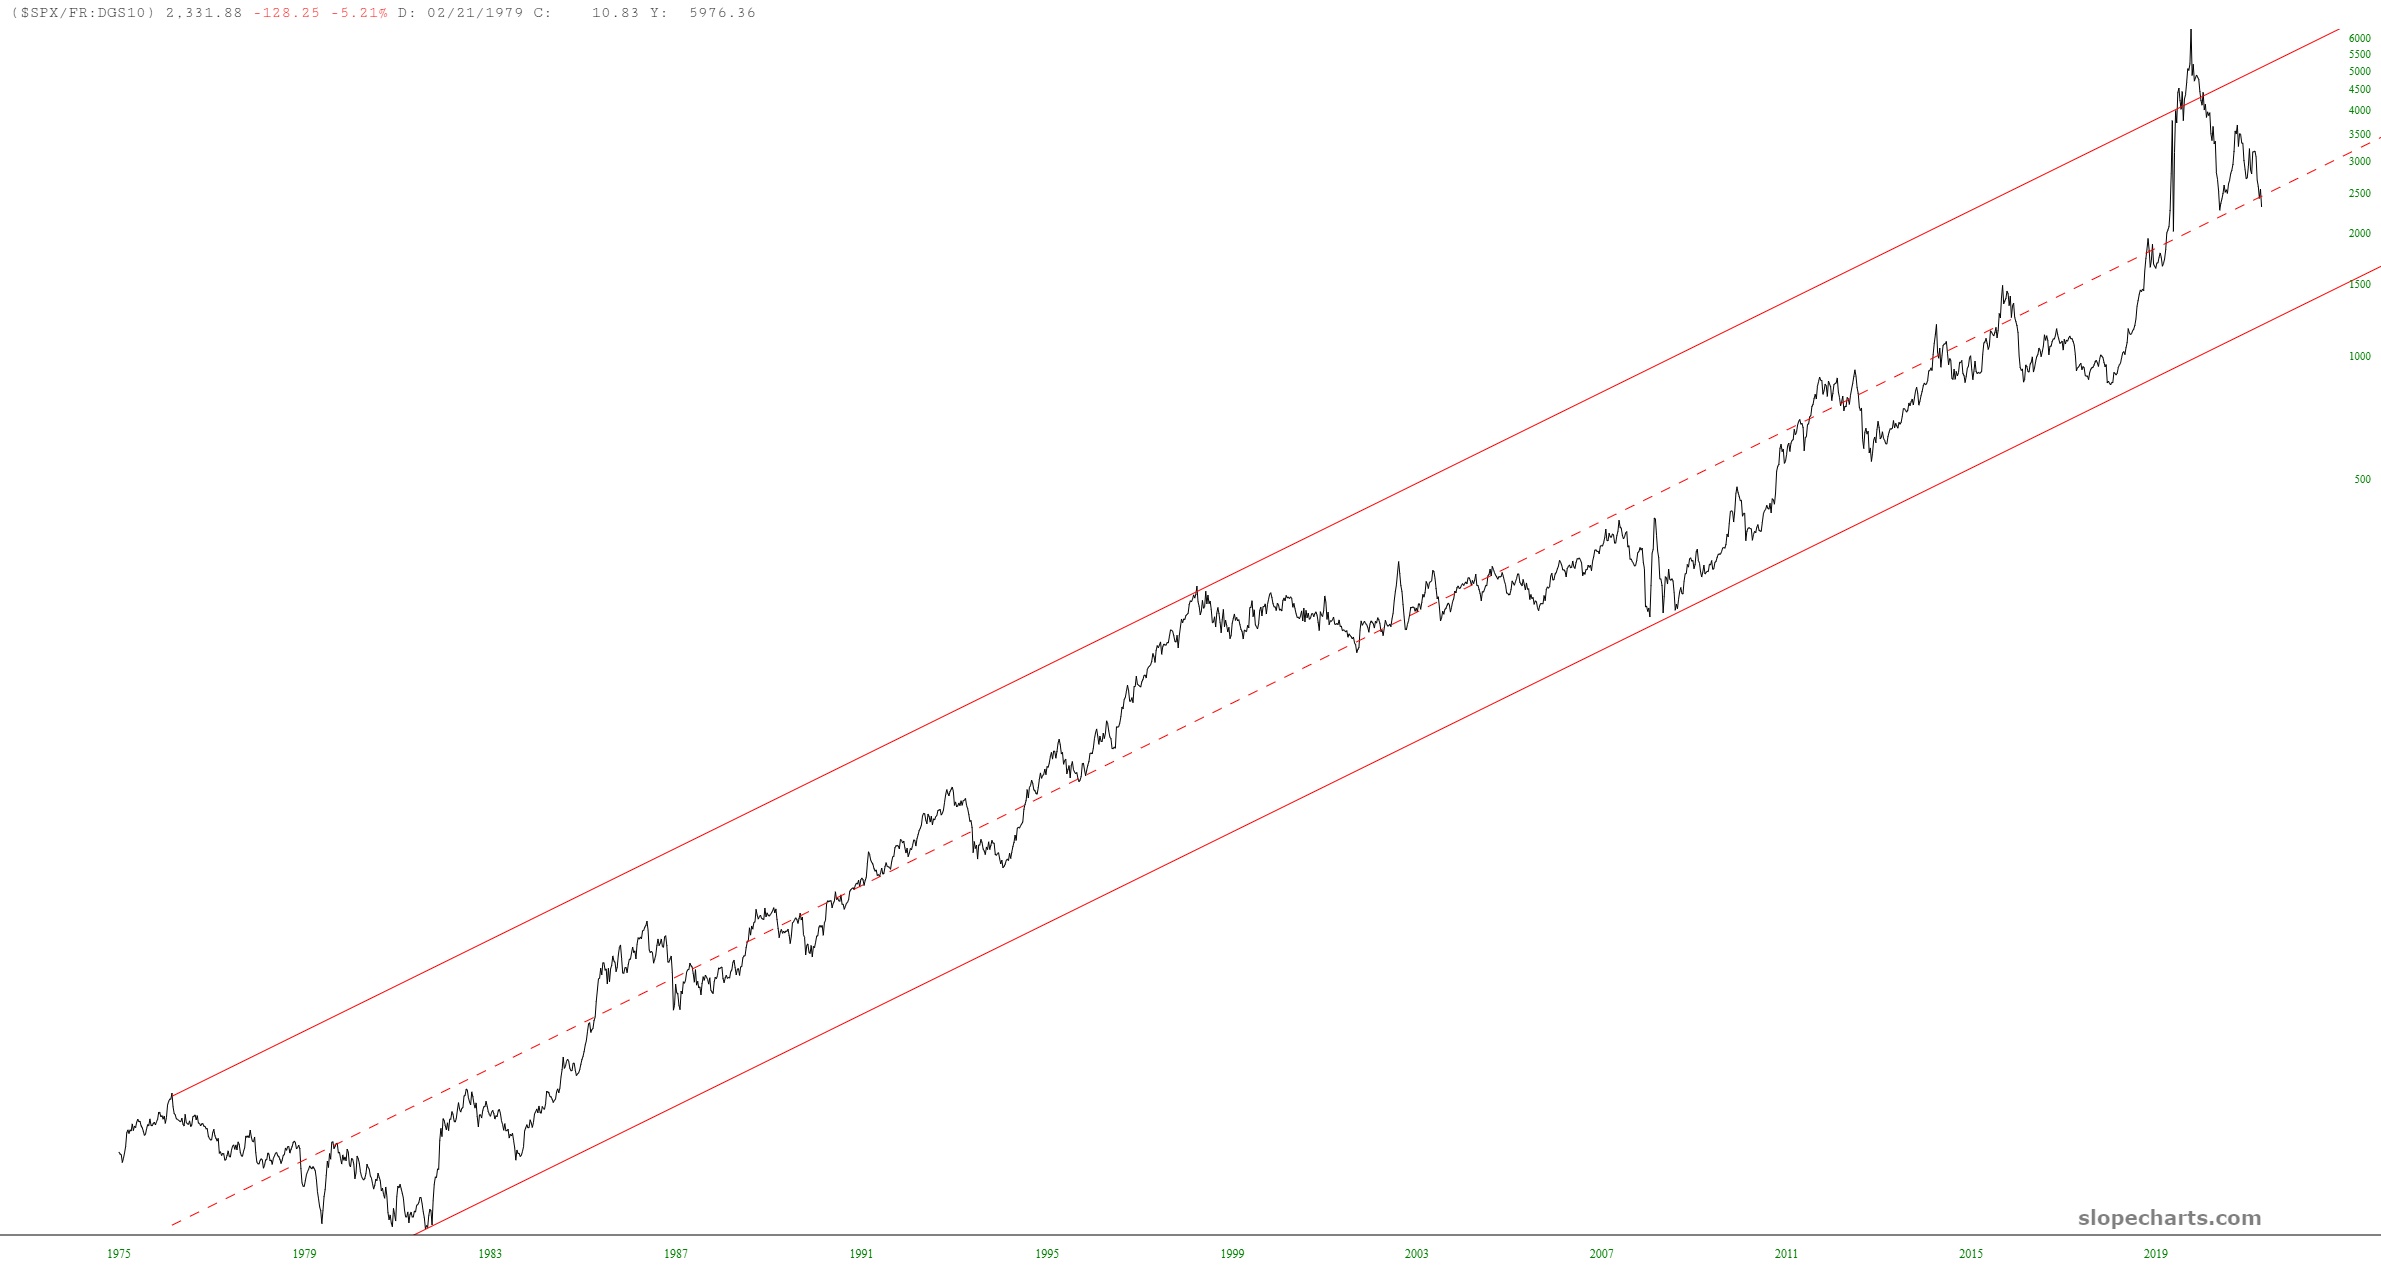
Below is an updated graph of my Most Important Chart Ever (MICE) which is the S&P 500 cash index divided by the ten-year interest rate. Quite clearly the days of ZIRP are behind us, and the one-two punch of higher interest rates and lower stock prices seems most likely in the years ahead.