
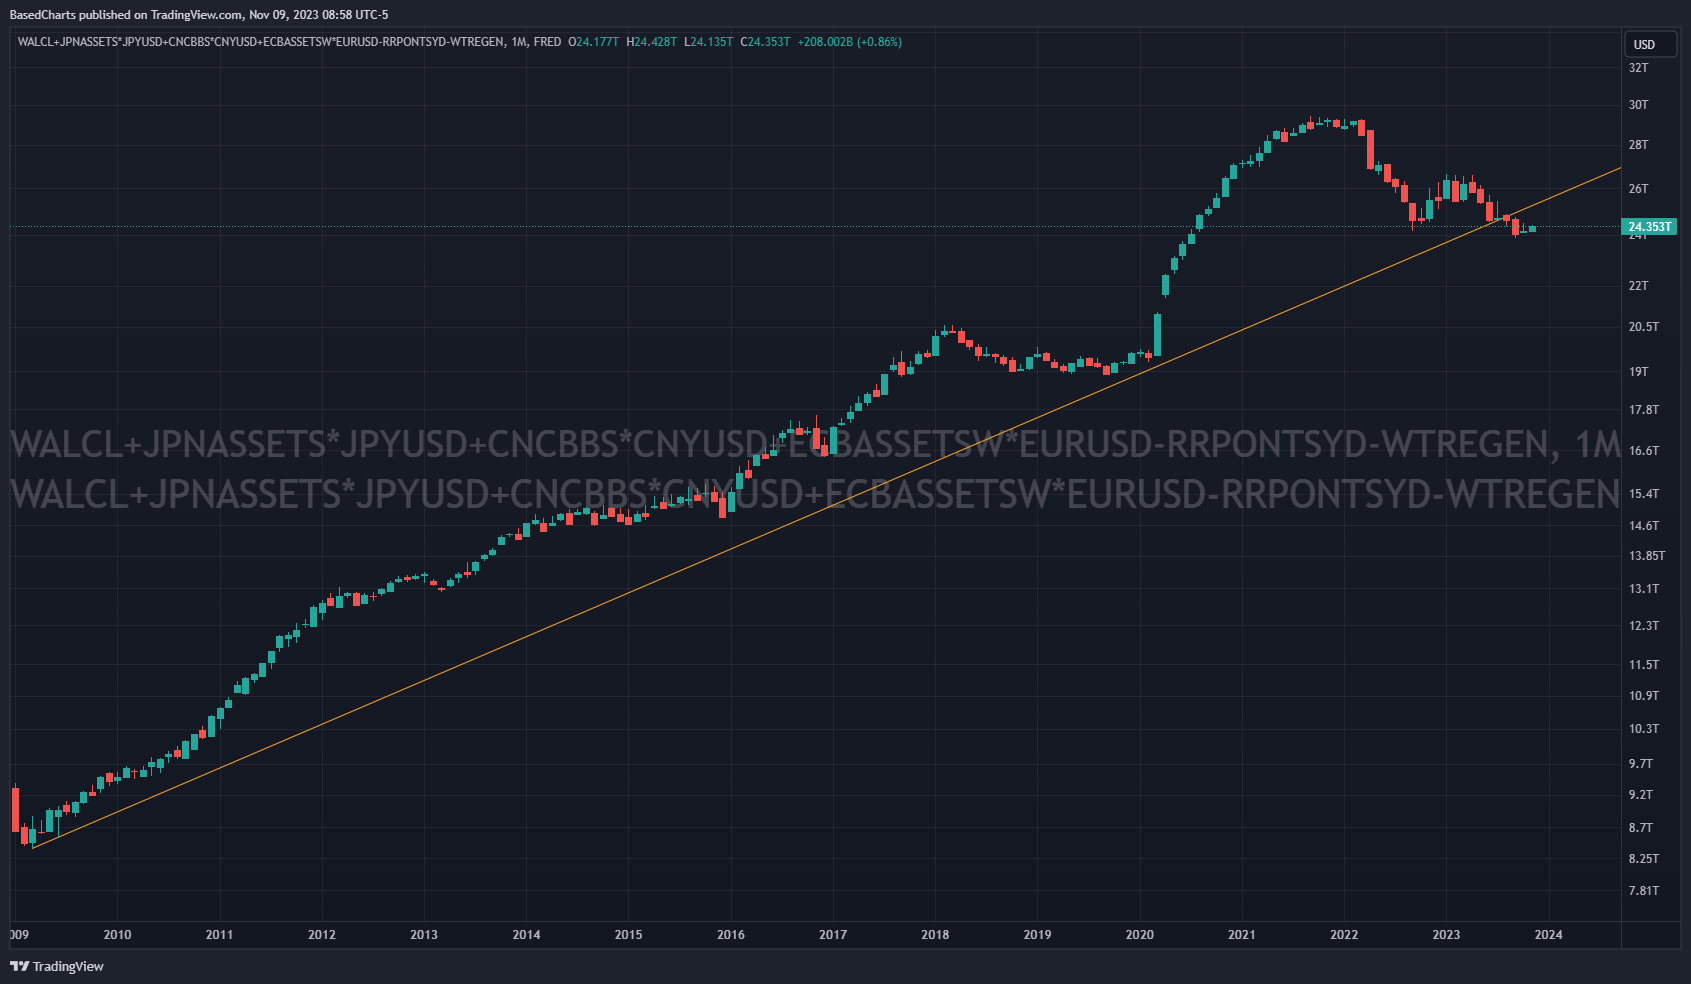
Central banks still control the financial markets and global monetary supply is growing below the trend established after 2009.
Below are central bank assets at the major central banks.
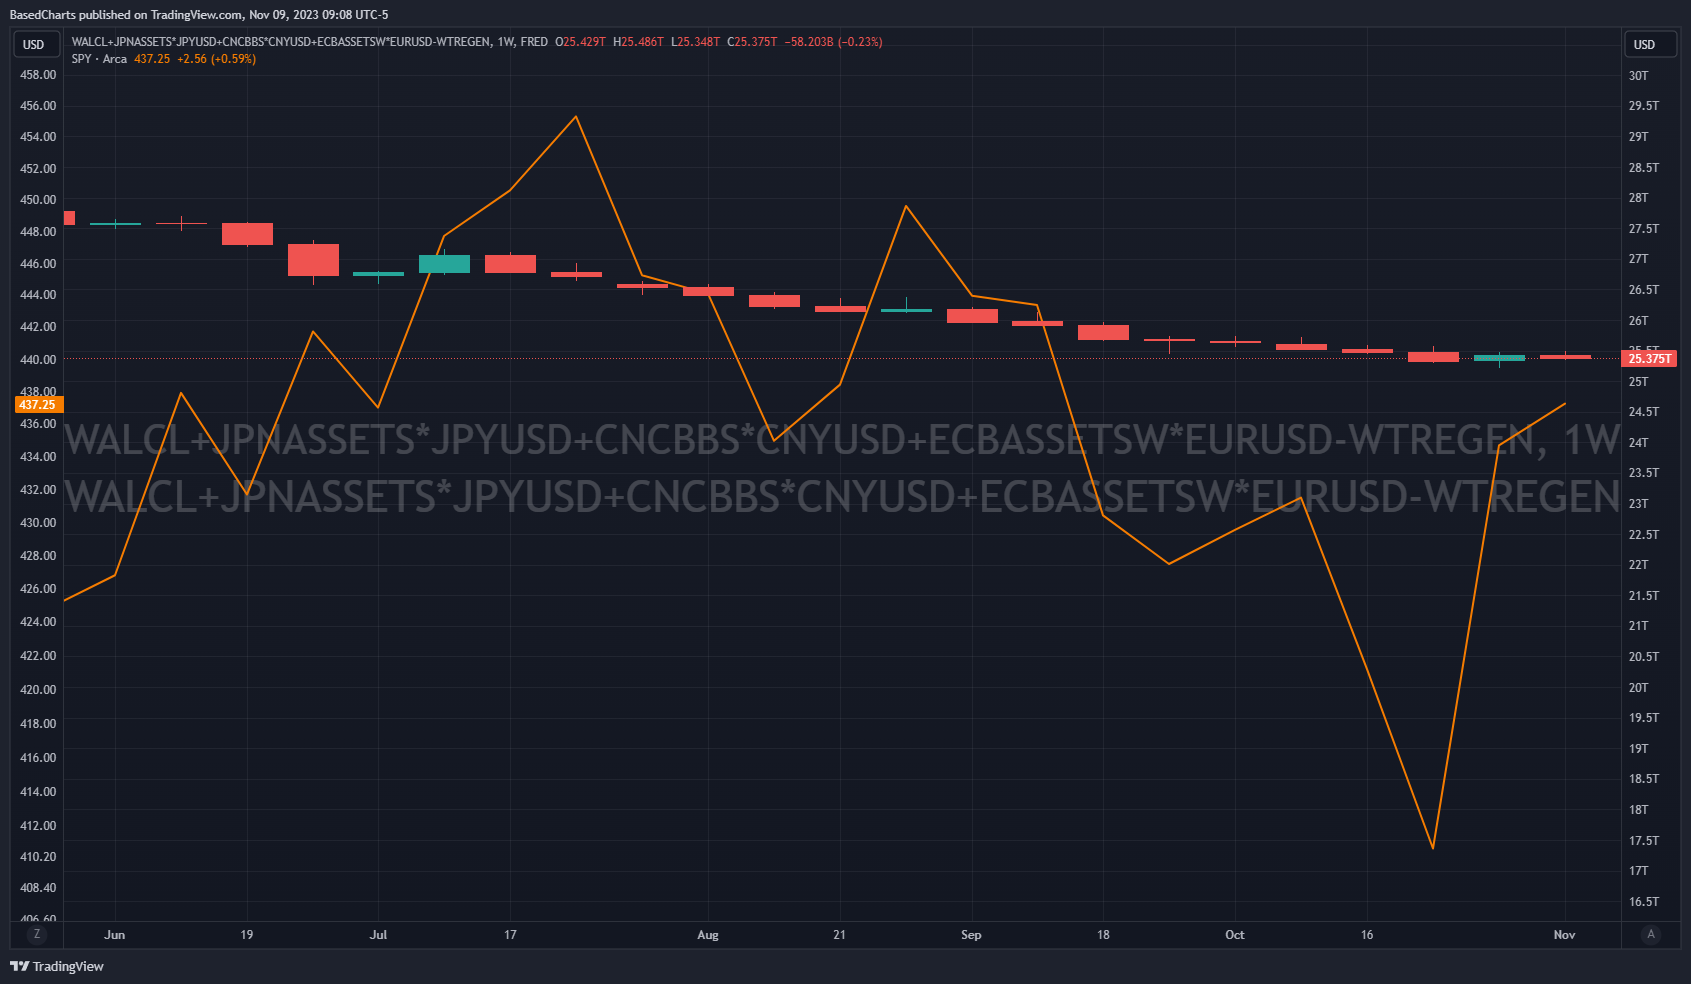
Here is a weekly chart zoomed in, with the S&P 500 Index alongside the central bank assets. This is not always the case, but notice how the green candles in central bank assets are correlated with upticks in the S&P 500 Index. SPX is like a positively-charged iron ball, and the central bank balance sheet a magnet that can flip from positive to negative. When central bank assets flip to positive, SPX shoots higher. When the assets are negative, SPX is pulled towards falling asset level.
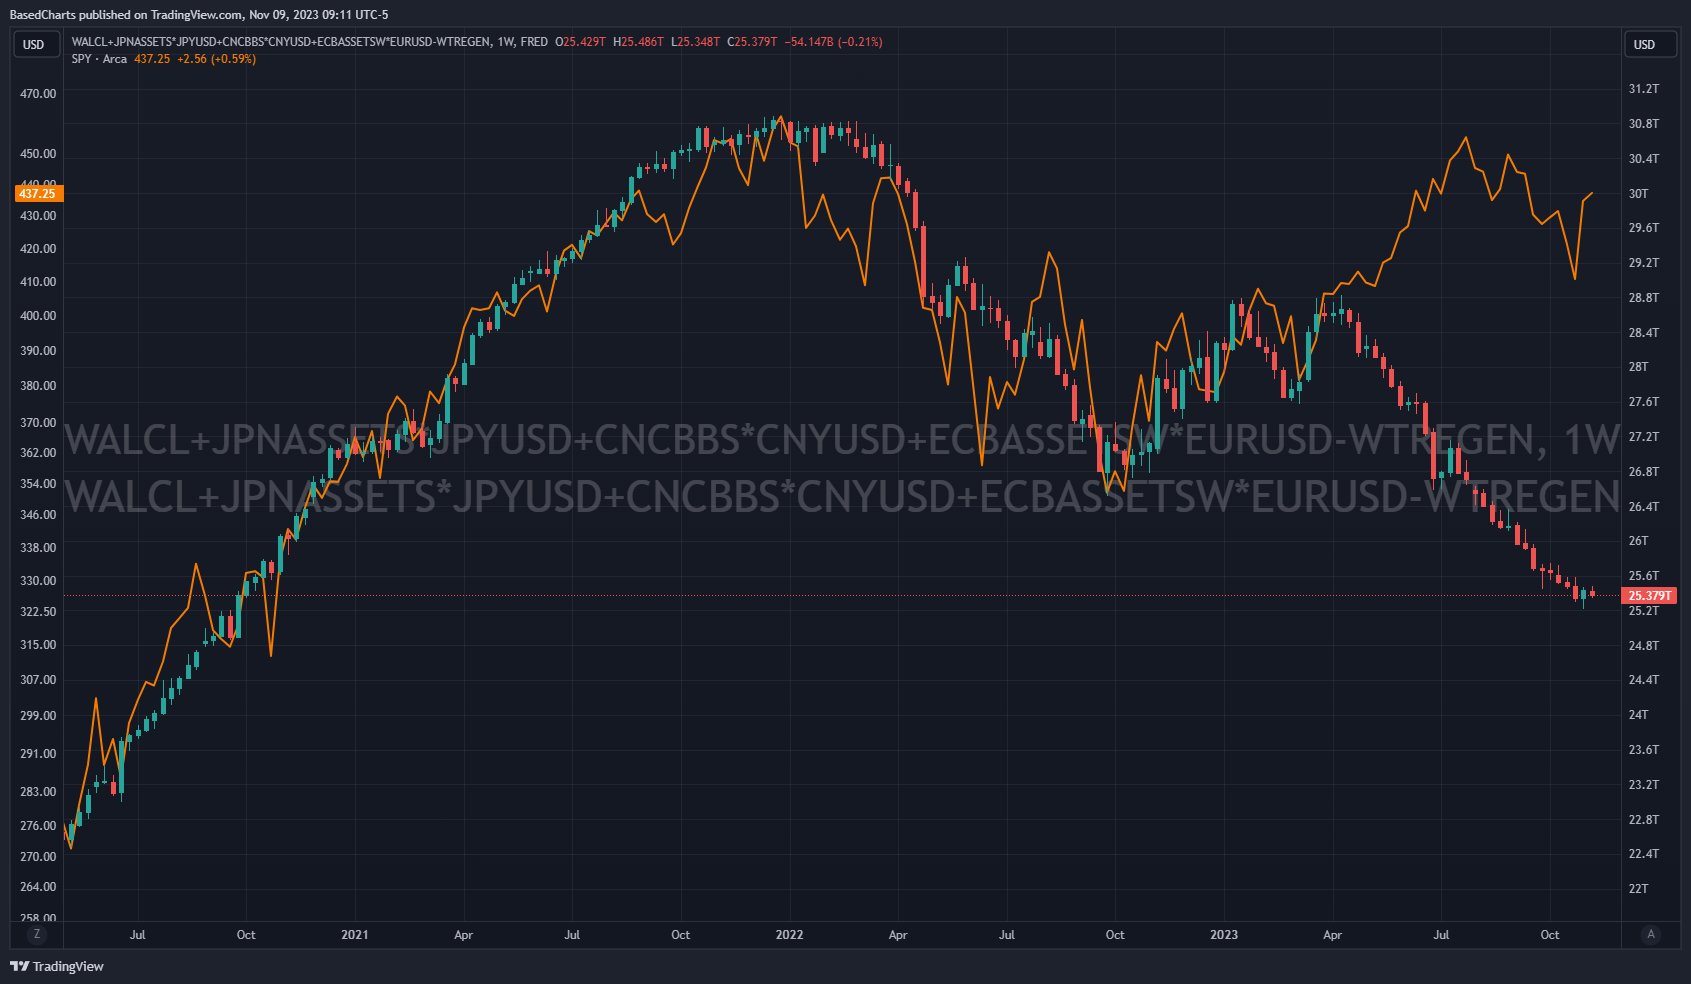
This is the picture zoomed out:
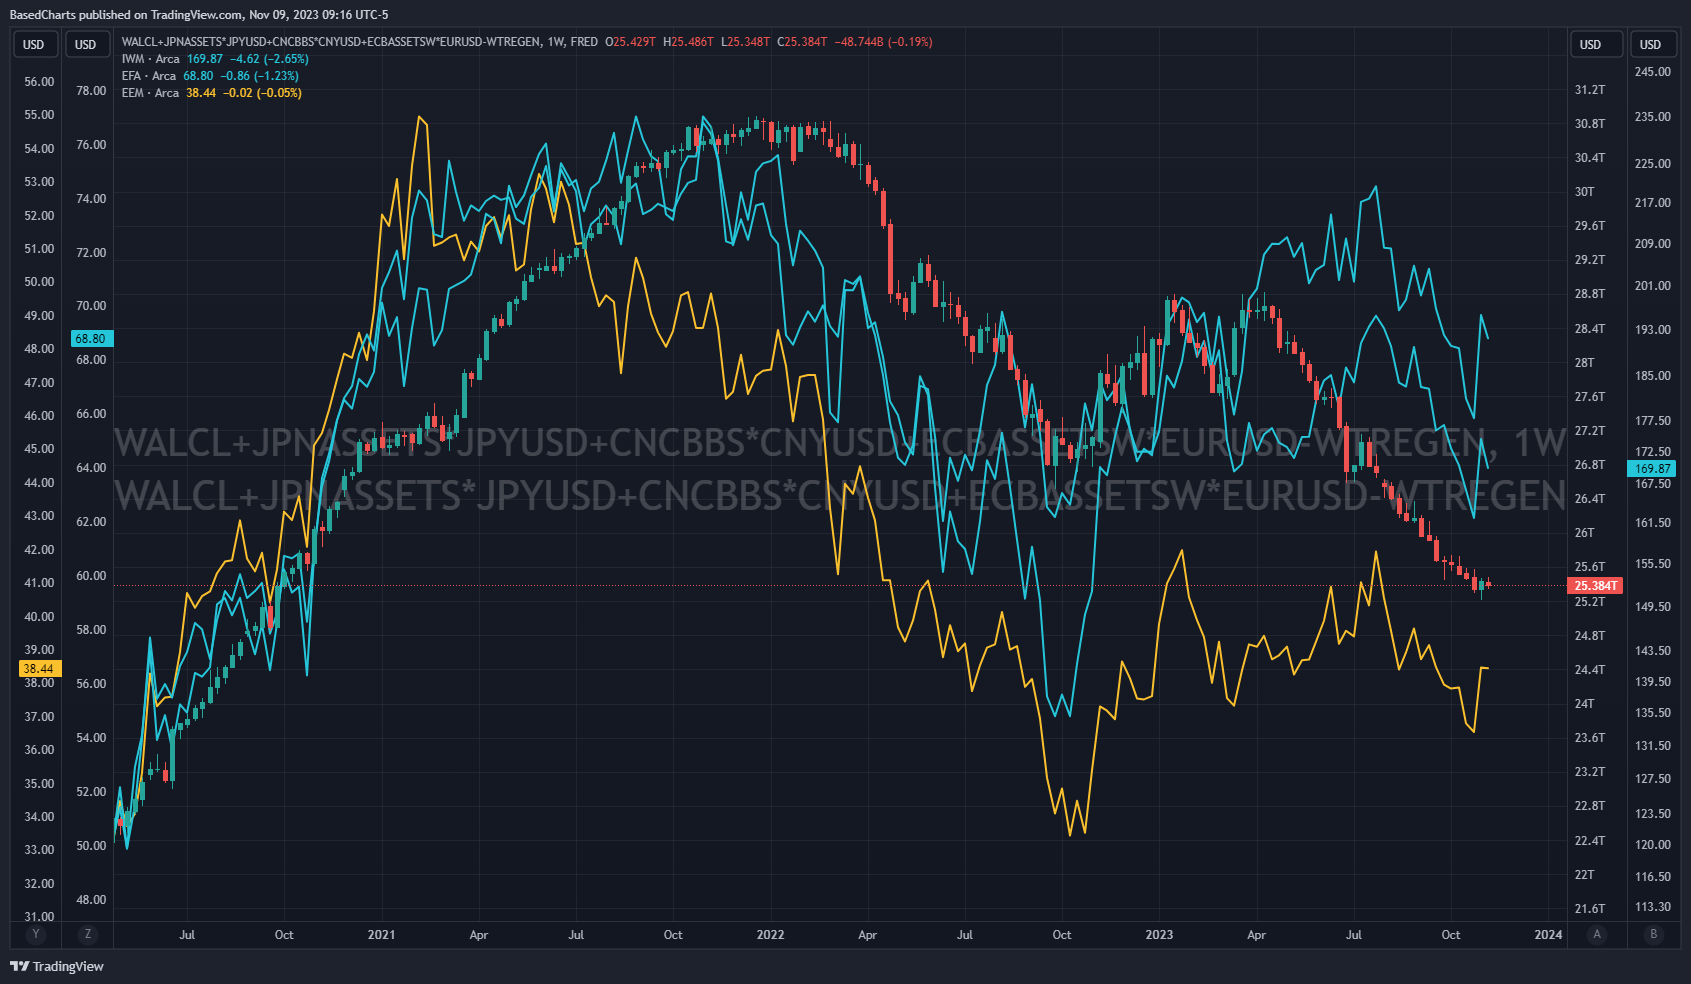
The stock market is the central bank balance sheet. In case you’re wondering, here’s the chart with small caps, developed markets and emerging markets (IWM, EFA and EEM). The above is the Magnificent 7, global outlier.
Back to the central bank assets chart. Notice RRPONTSYD, overnight reverse repo at the Federal Reserve, has a negative sign. It acts like reverse-QE. As RRPONTSYD goes up, it takes liquidity out of the market. As it comes down, it lifts global liquidity.
Eventually it goes to zero though. Let’s see the picture without it. First, here is the above chart again, zoomed in and changed to a weekly timeframe:
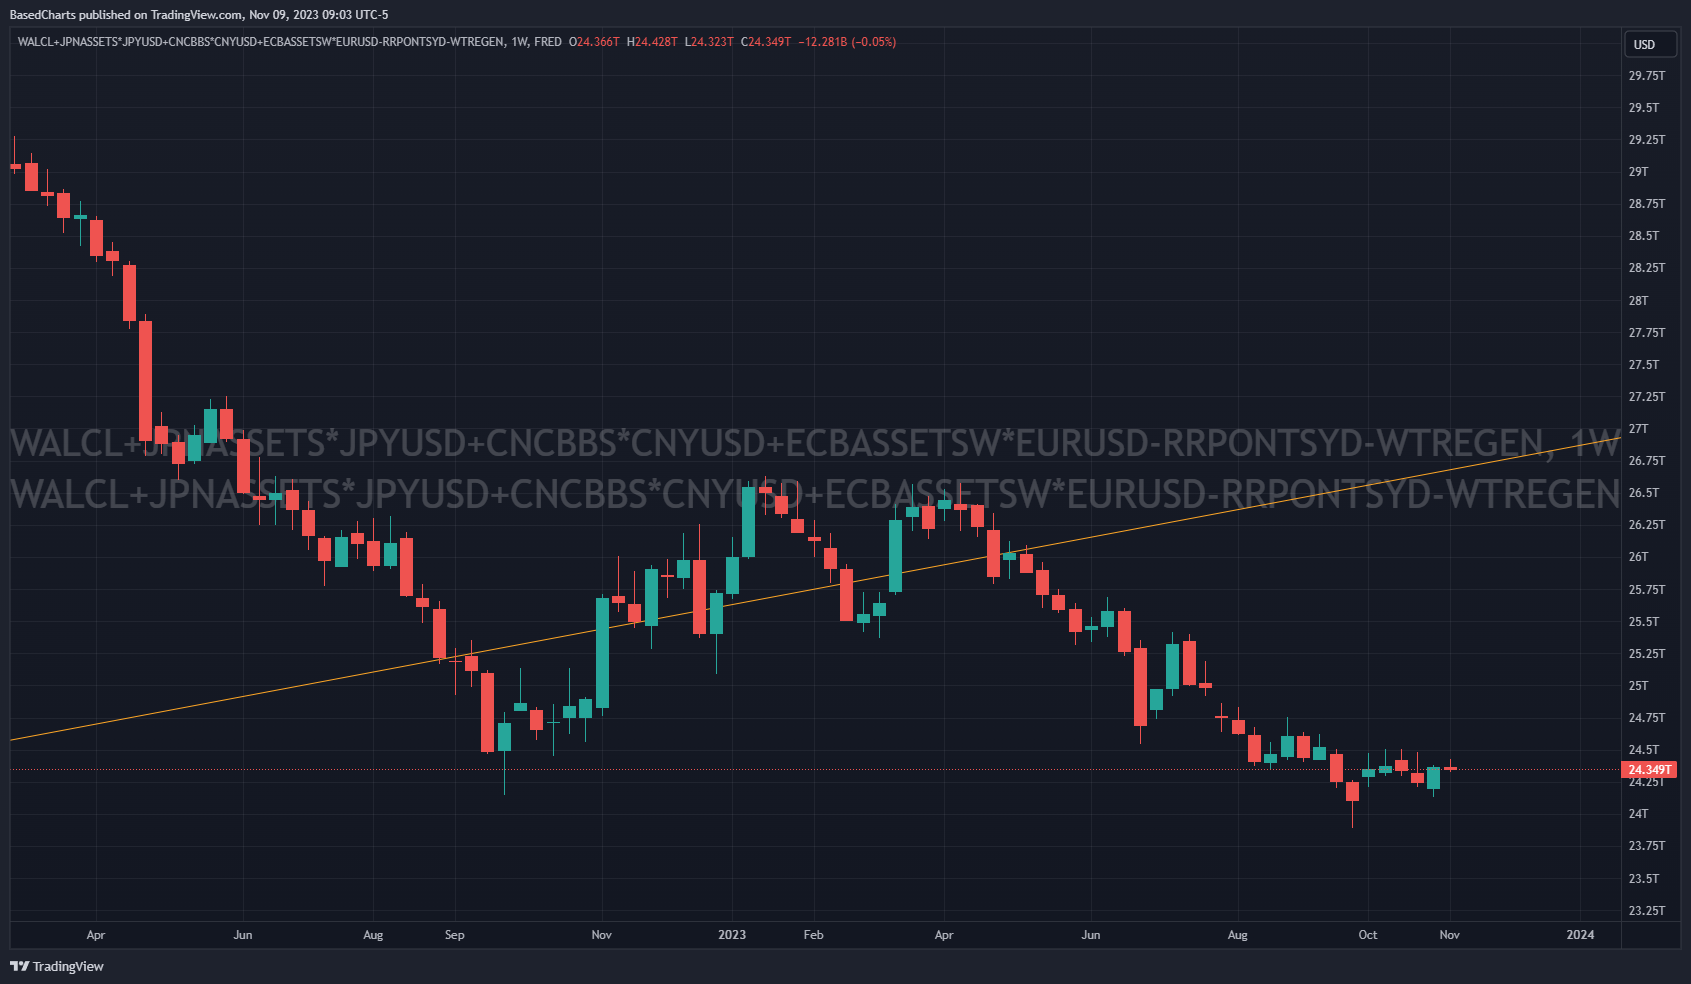
Here it is with the repo removed:
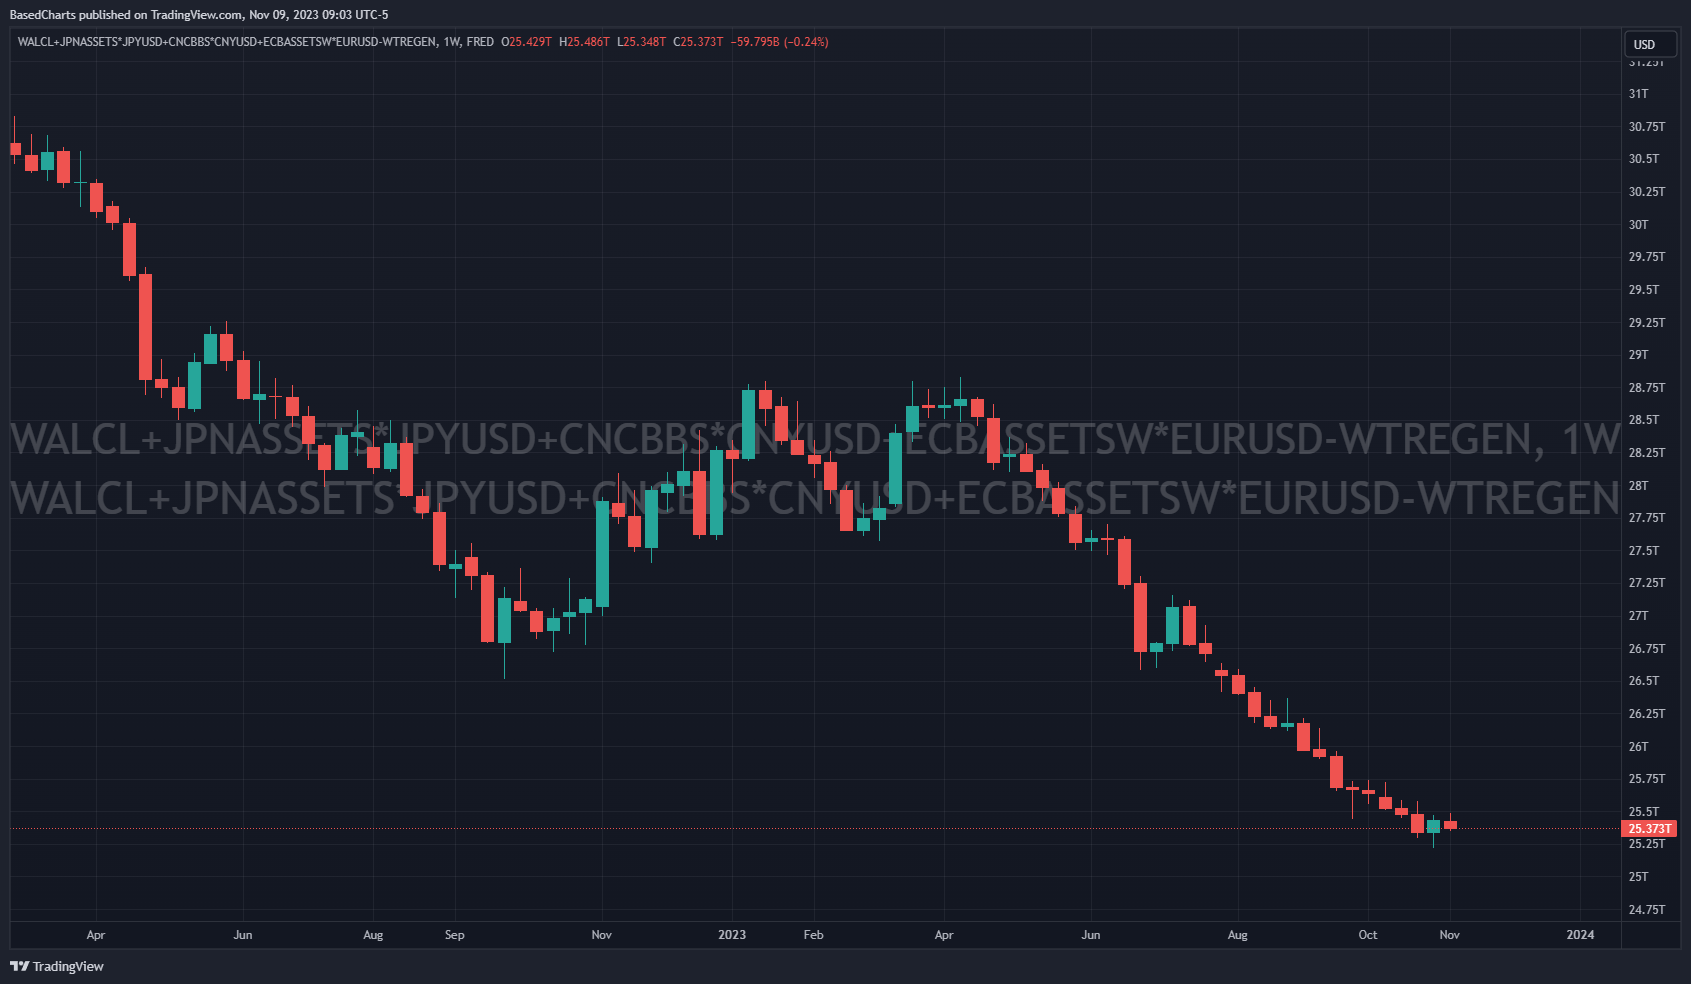
Reverse repo has been tumbling since May, but it wasn’t really a factor in this picture until around July. That’s when the stock market peaked. Reverse repo has covered up the constant trend of declining central bank assets.
Ignoring the direction of central bank assets week-to-week, which can be somewhat random:
The immediate bearish interpretation: repo is already being overwhelmed by other liquidity factors. Whether this is true now or not, it is likely that repo will stop mattering well before it hits zero.
The immediate bullish interpretation: repo is offsetting falling central bank assets, opening a window where markets can go higher.
The longer-term interpretation rests on the direction of the global central bank balance sheet. If assets keep falling and stocks rally during the window of falling repo, it sets markets up for a plunge. If at any point central banks give up on their reversal of inflation, then stocks could bottom for a time.
The additional factor with stocks is their high valuations. There was a large correction in 2018, another in 2020, small-caps, EMs and speculative assets peaked in February 2021, mega-cap tech reversed in 2022, small-caps reversed in 2023…every year has seen a bear market somewhere or everywhere in stocks. It might take something like the 2020 pump to lift everything, but to get that would also require March 2020. If central banks merely hold the line, there will be someplace for bears to play.
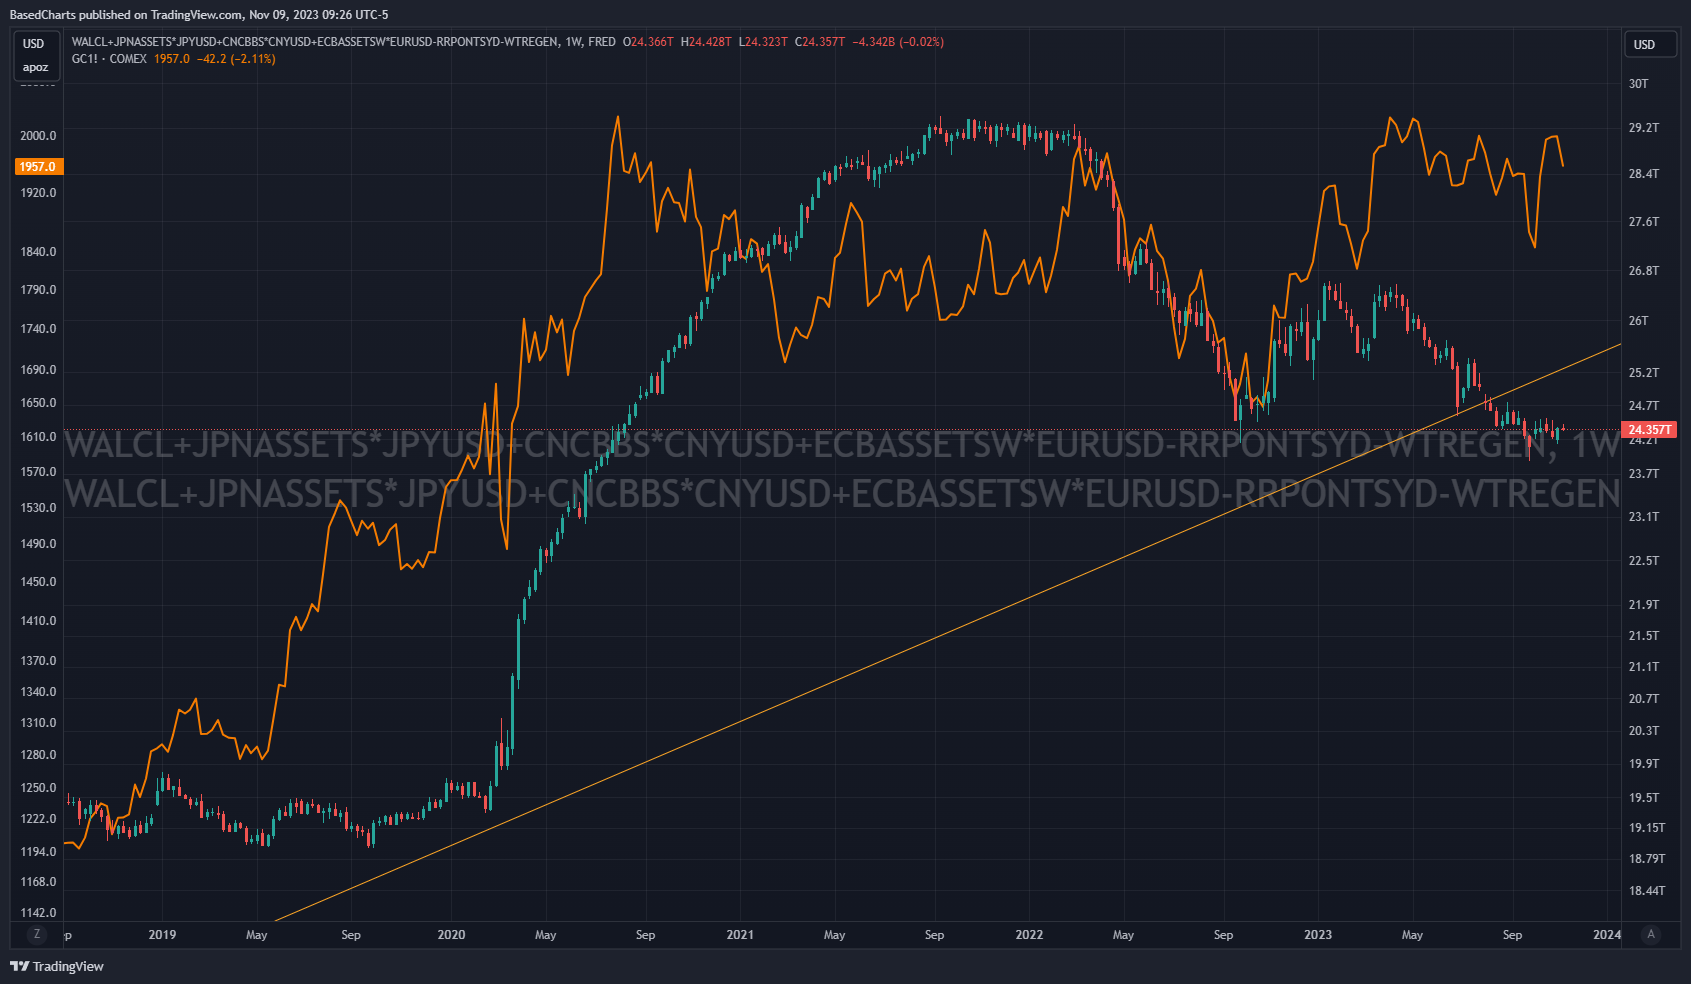
Watch Gold
As for the future, gold has been a decent indicator in the past. Although gold hasn’t hugged central bank assets like the S&P 500 Index, it has often turned ahead of the central banks, usually about 6 months or so going all the way back to the peak in 2011.
The earliest warning came in late 2018 when gold correctly told us the Federal Reserve was about to give up on quantitative tightening and rate hikes. Global central bank assets went a little bit lower because the Fed didn’t give up QE until September 2019, but gold correctly predicted a surge in central bank assets was coming, long before there was any accidental or intentional release of a human-engineered coronavirus.
A bullish breakout in gold would eventually be bearish for equities because, with inflation still a concern among the public, reversing course would greatly damage the reputation of central banks. They won’t give up without an excuse. If gold hints at an explosion in central bank assets, then it hints at something that will panic the public. Sans another virus, war or natural disaster, it would hint at a major recession and possible financial crisis. An imminent bullish breakout in gold from its 3-year consolidation range could mean a recession coming by the second-half of next year at the latest.
Conversely, if central banks are going to continue the fight until the public and politicians scream no more, then perhaps gold has one more huge flush ahead of it, as it had in 2008 before quantitative easing kicked in.
