Preface to all posts: Instead of my typical ETF videos over the weekend, I went through all the charts and put them into certain groupings. In this post, I cover the ETFs that seemed appropriate for the grouping mentioned in this post's title.
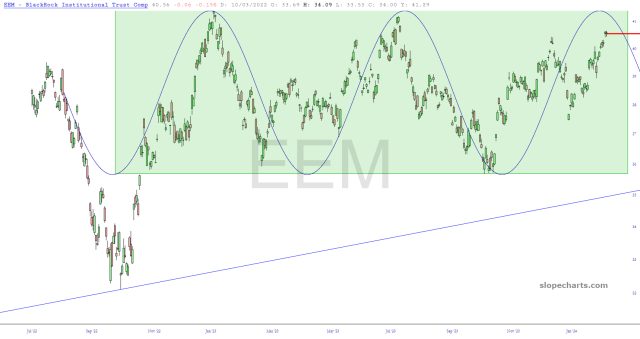
The easiest charts to follow are those trapped within a price range. Of course, there will come some time that the price escapes from such a range, but one can approach a chart like this with the premise that the range is going to remain intact (until it doesn’t!) and set up the trade accordingly. Here is the fund for the emerging markets, which is not only range-bound but seems to be following a regular time pattern.

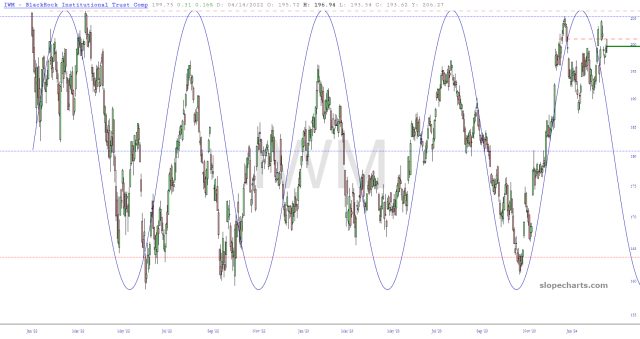
Then there’s the small caps, which have been banging around their range for a good two years now.

Biotech doesn’t quite fill the bill, because it spent a good luck of its time just meandering around the upper half of its range, but I thought I’d share this anyway, since XBI hardly ever gets mentioned here.

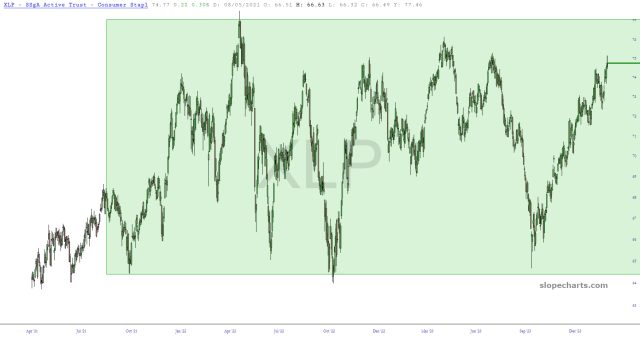
Perhaps the same can be set for consumer discretionary.

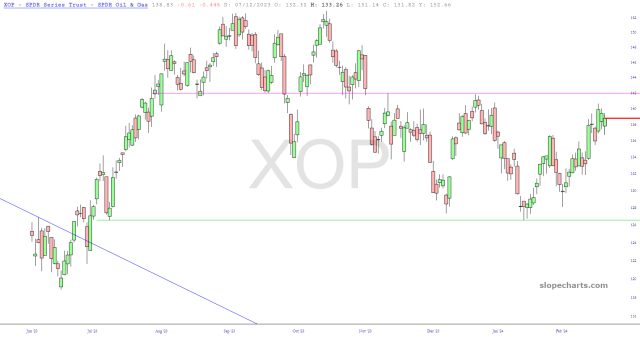
The oil and gas fund, XOP, is a bit of an odd duck, because it traded within a higher range for a while and then broke to the lower range, where it has been for weeks. I’ve got puts on this, so I’m hoping it’ll work its way to the lower zone of its present range.


