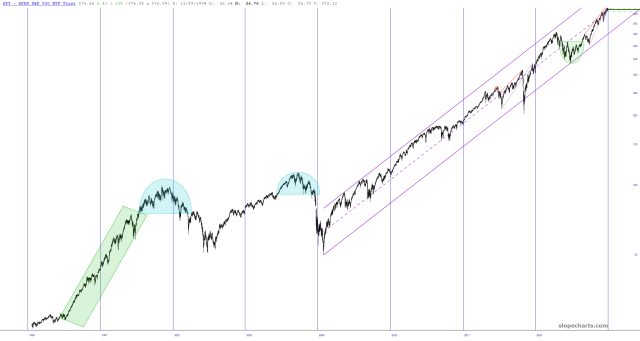
I just heard something about an election happening today, so I decided to brush off the ol’ Event Markers feature. Here is the SPY overlaid with the Presidential Elections.

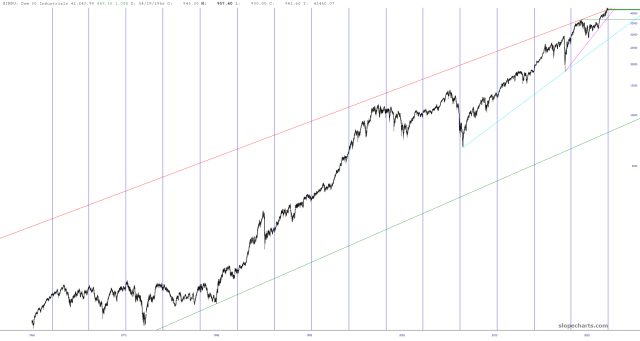
Hey, I can go back farther!

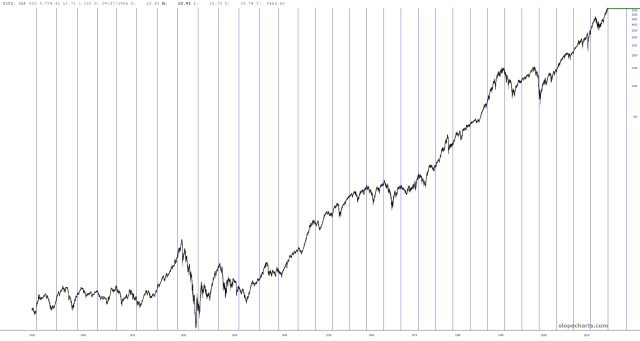
In fact, we have all the elections back to 1900, which is as far back as SlopeCharts is capable of showing.

The relationship between elections and equities has changed over the years, and it seems in the 1970s the elections usually marked a peaked. In recent decades, however, it seems to have about as much meaning as Groundhog Day.

