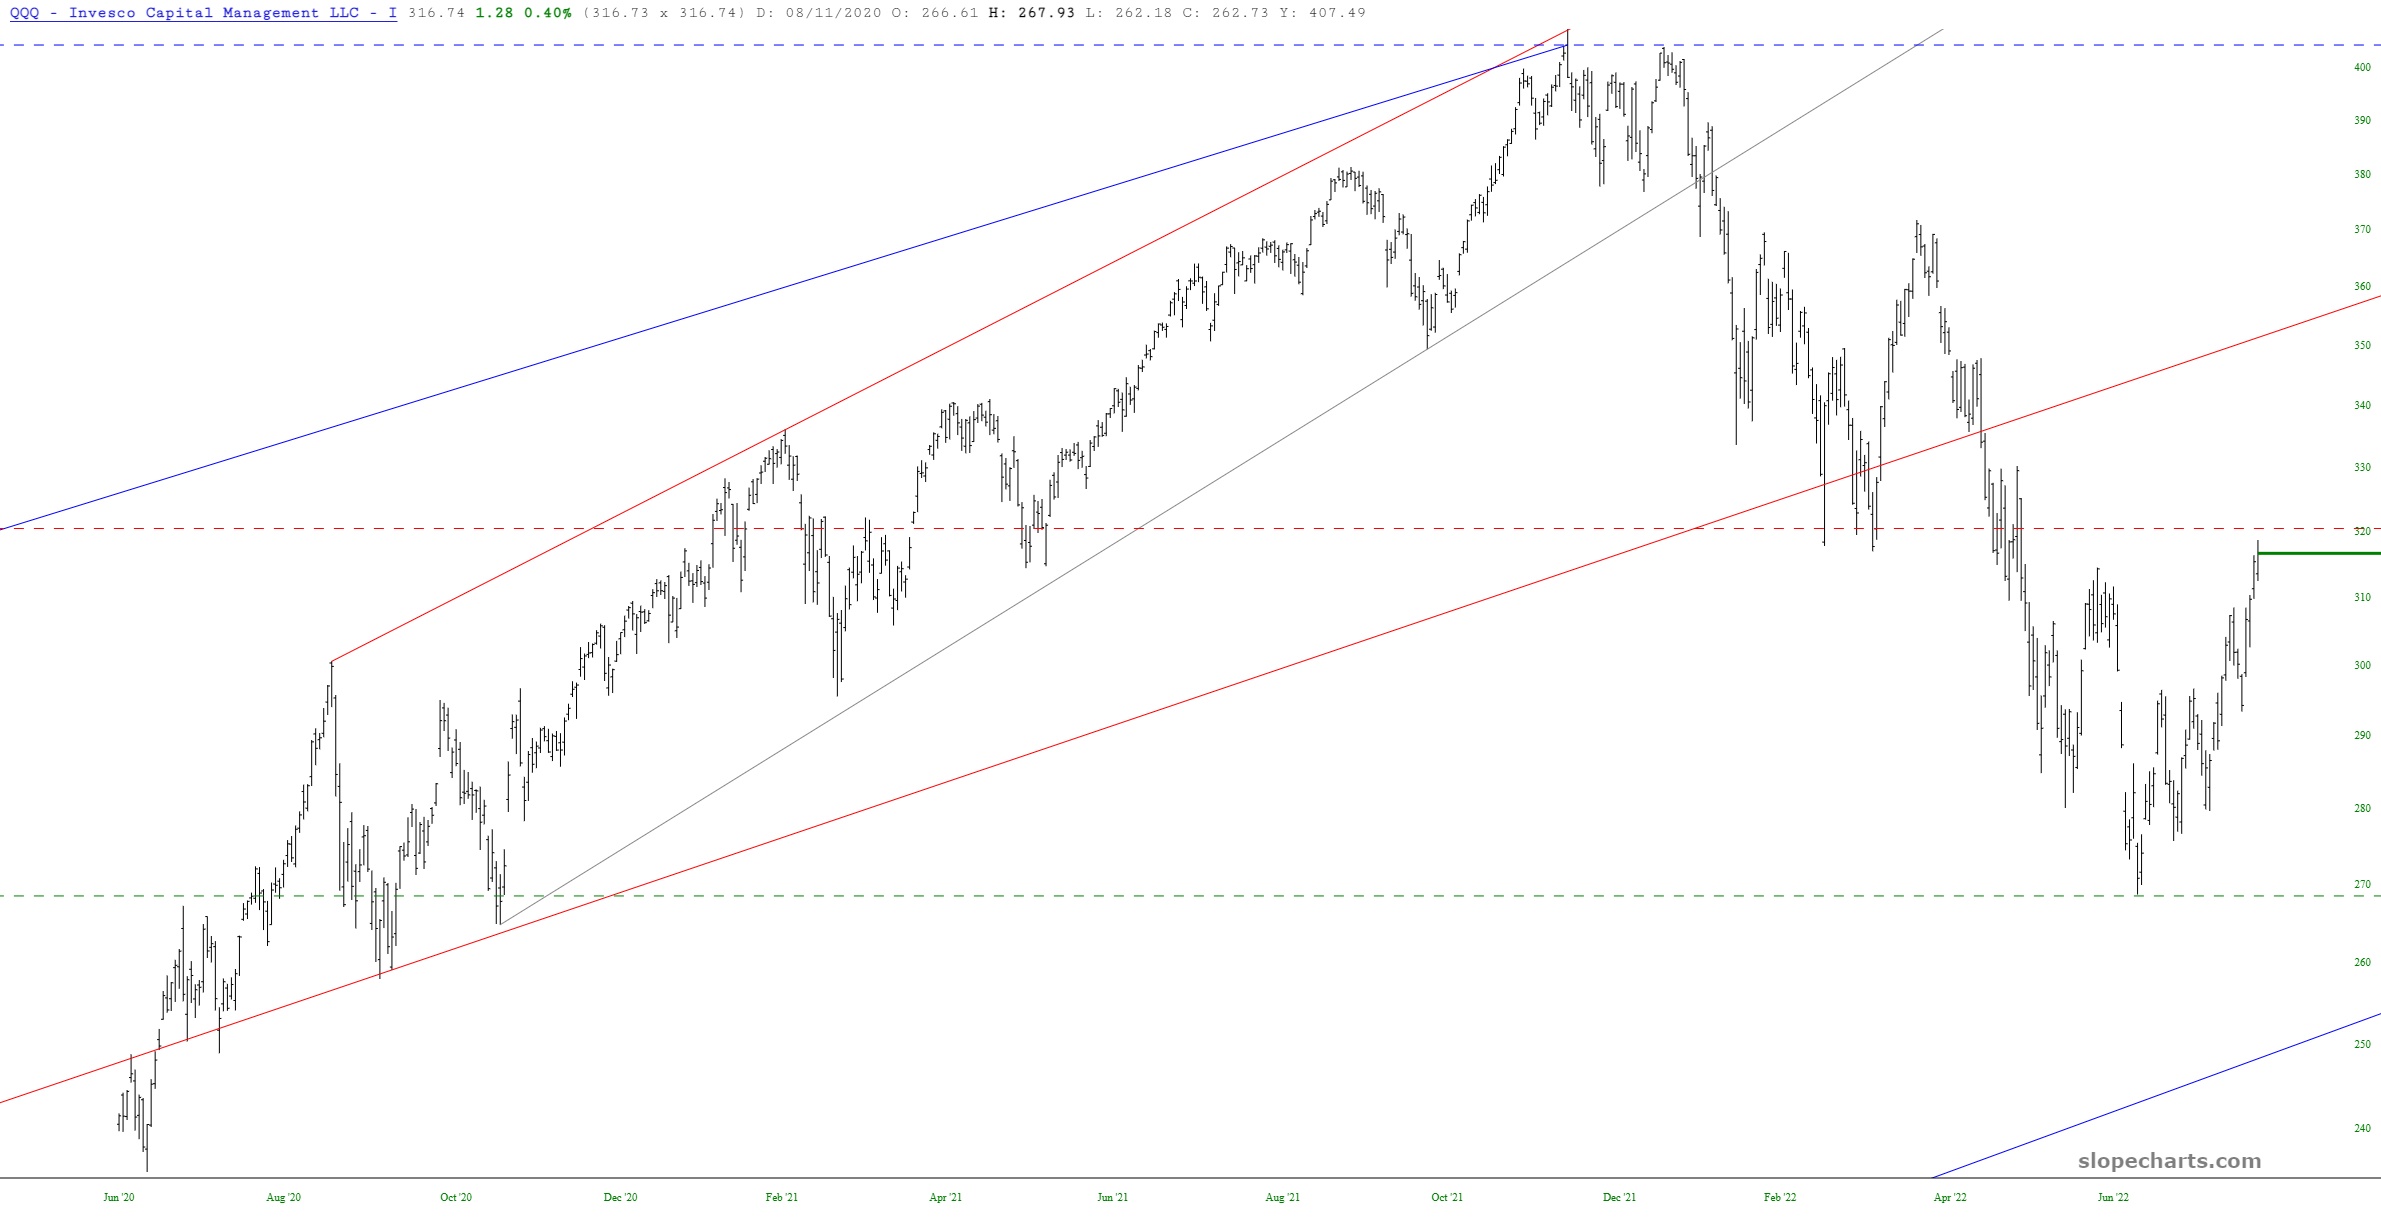
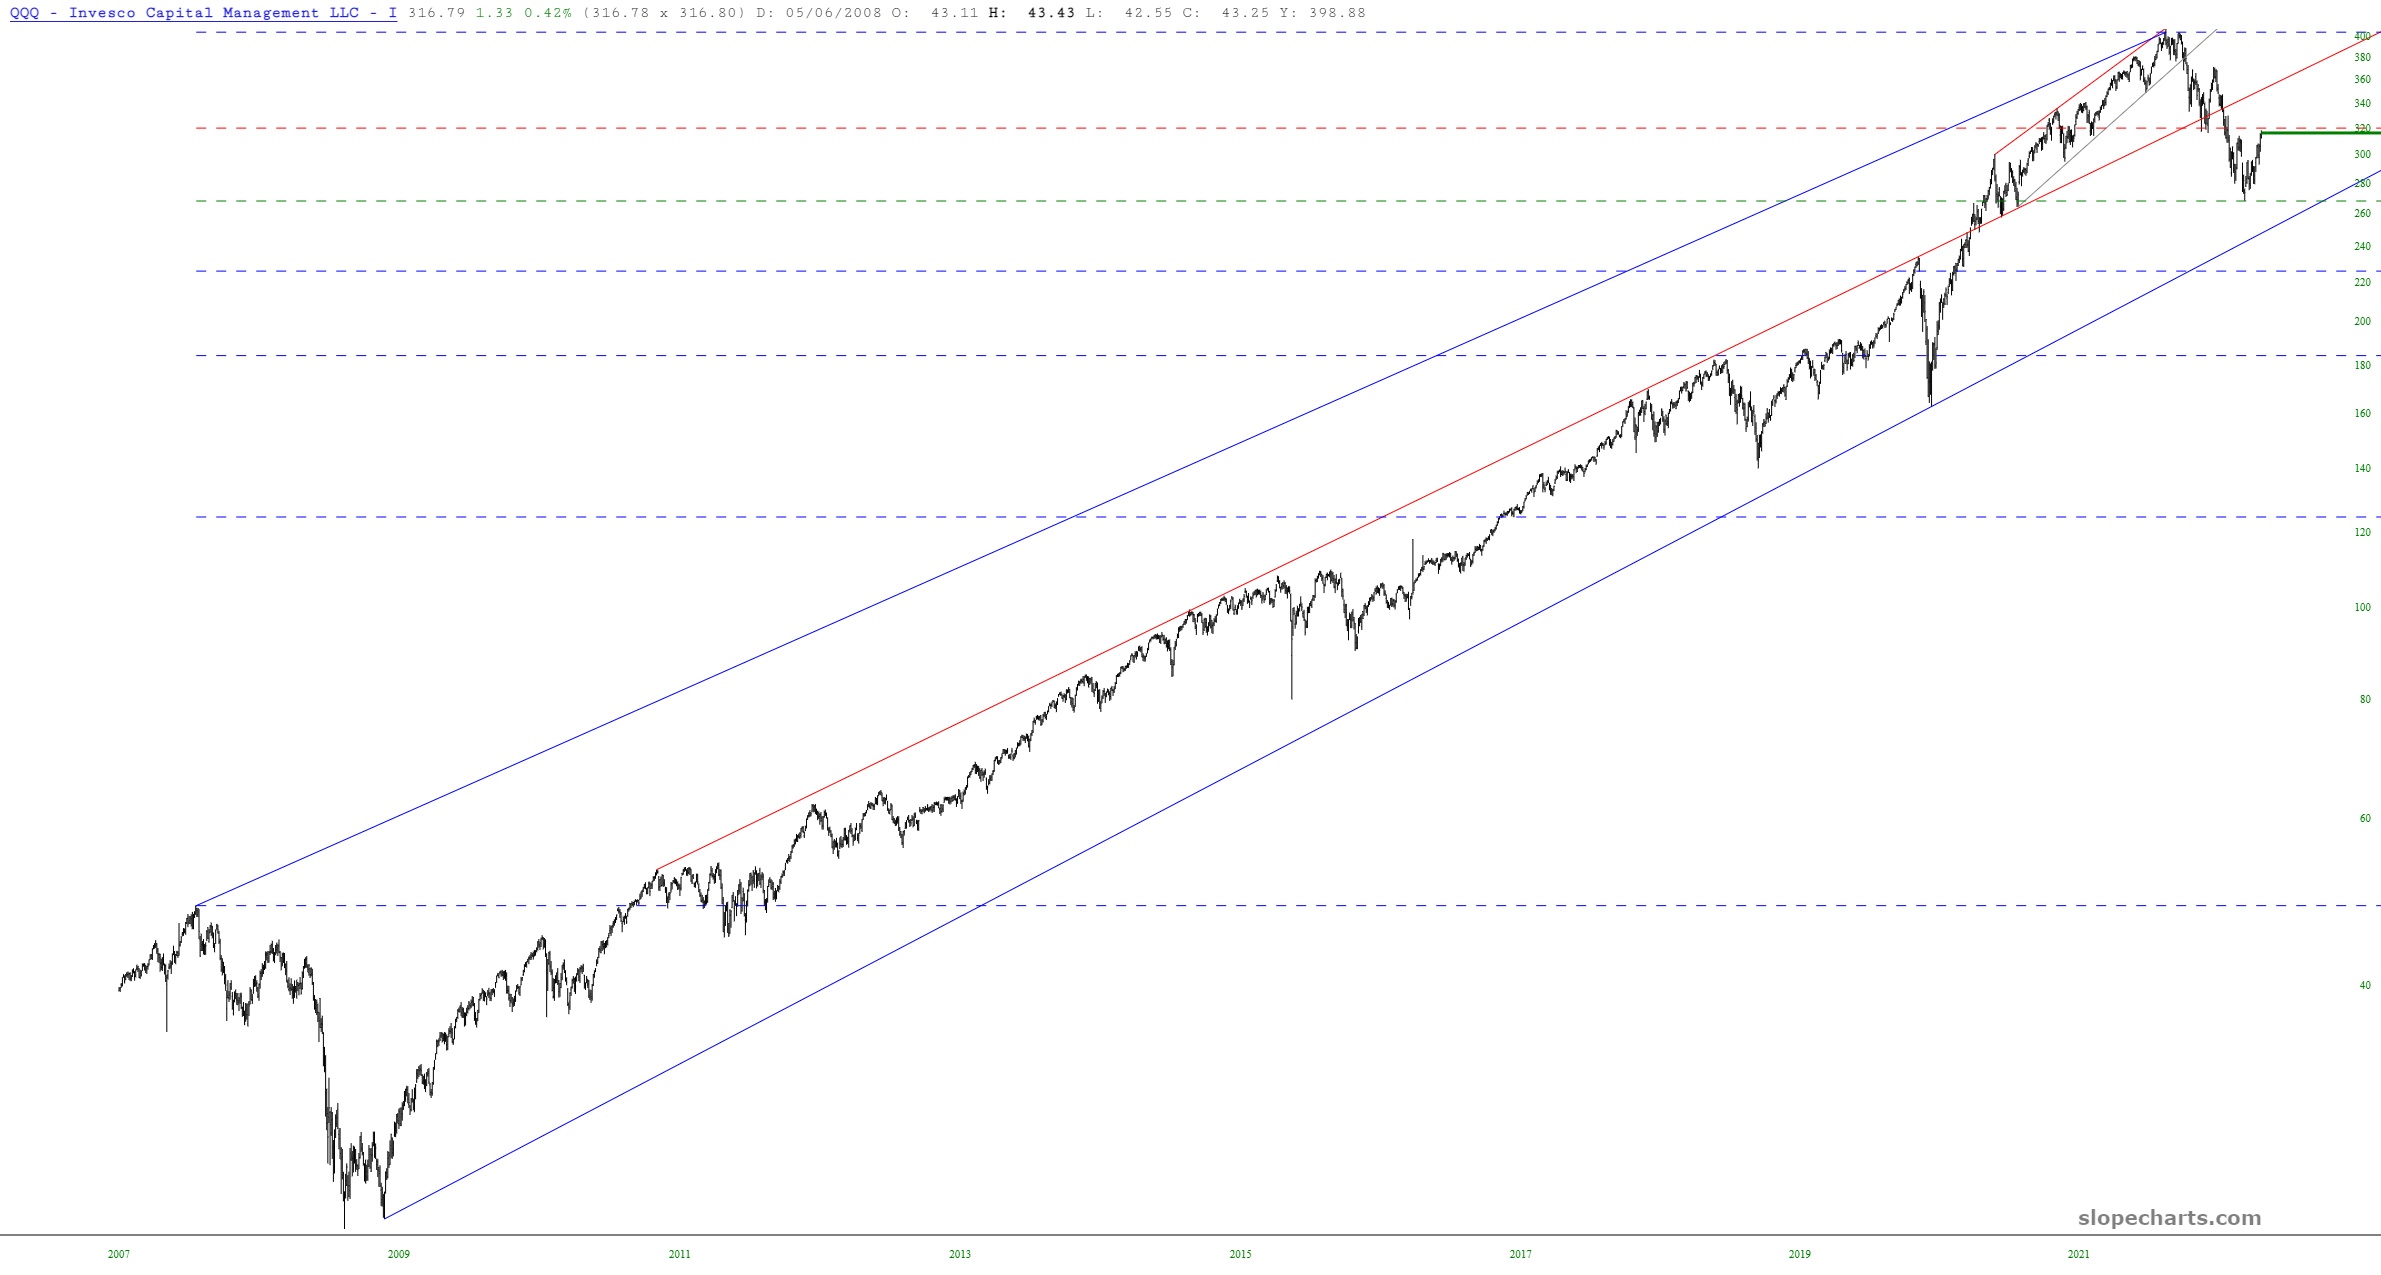
I have something interesting to share about the NASDAQ fund QQQ. Take a look at this long-term chart below. What I’ve done is anchor it to two extremes, as usual, but what’s different is that instead of anchoring it to a low and high extremes, I’ve anchored it to two highs: specifically, the one before the financial crisis struck (2007) and then last year’s peak (November 2021).
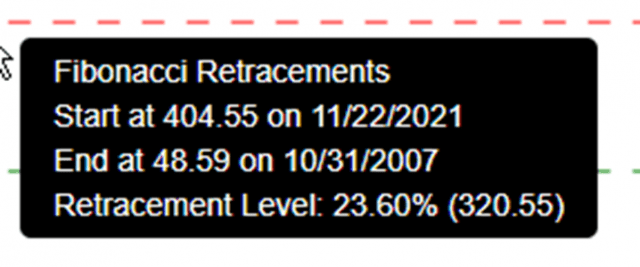
Here are the precise levels I’m using:
What’s intriguing to me is how the plunge (which, sadly, terminated in June, at least so far) nailed the retracement level virtually to the penny, and right now, we seem to be hitting important resistance at the next level higher. I want to emphasize these are major retracement levels drawn over a period of a decade and a half.