
If it feels like decades since the market has gone down, that’s only because you’re correct. Each night, before flicking off the monitors, the /ES looks something like the chart below, threatening to finally slip below support……..
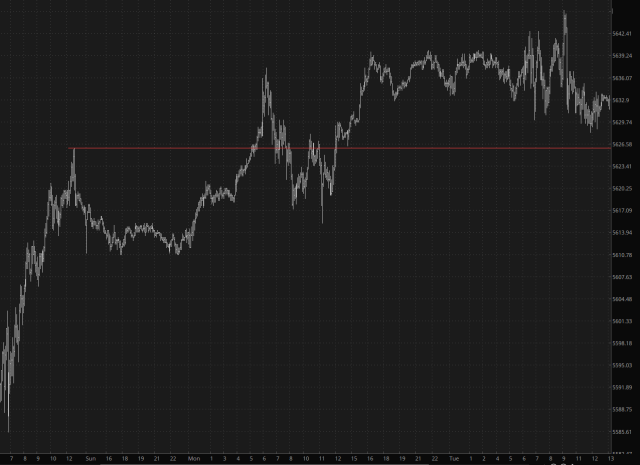
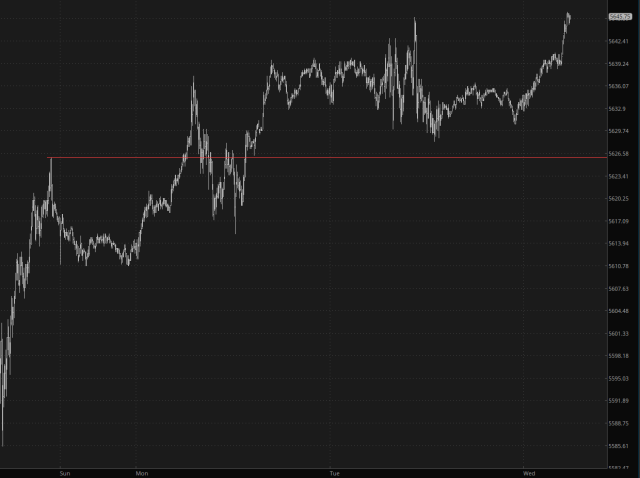
…….and, as sure as the sun rises each morning, the /ES defies gravity and pushes on to Yet Another Lifetime High ™.
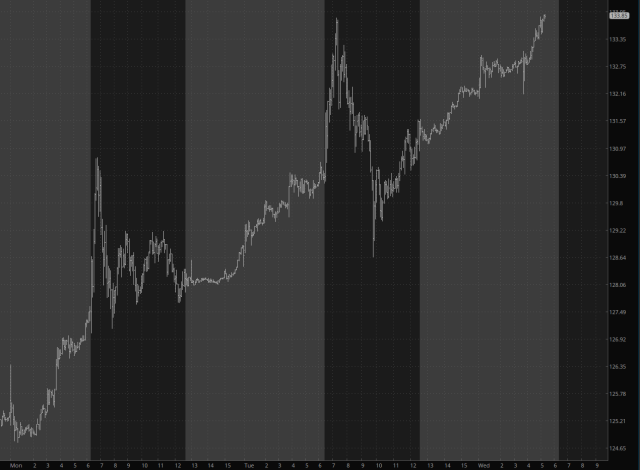
This continues to be played out among the multi-trillion dollar mega-caps such as NVDA, below which, yes, has some brief “shock drops” for an hour or two and yet always, always, always recovers.
Breadth remains atrocious, valuations are the highest in history, and puts are nearly free for the taking, but the mass of humanity has understandably become married to the notion that there is no such thing as a shrinking asset. Over the past eight months, the weekly SPY chart had one and only one brief dip (back in April) yet otherwise has been a straight and predictable as a child’s classroom ruler.
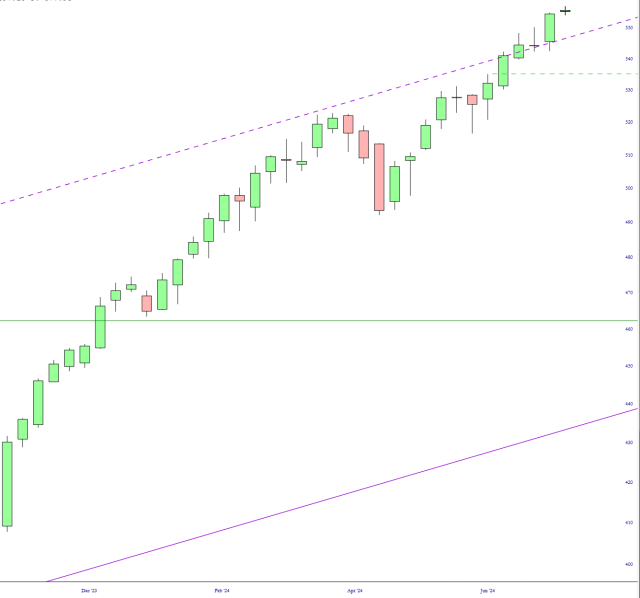
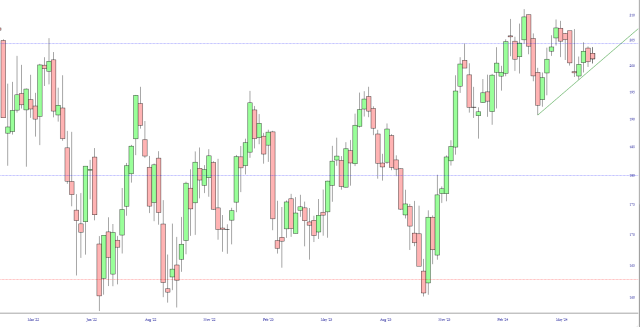
The glaring exception to this is the small caps, shown below by way of the weekly IWM chart. We are near the top of the range, and a failure of the trendline I’ve drawn would open up the prospect of a trip back down to the next horizontal Fibonacci.
I remain in position with September, October, and November puts. To the bears out there: good luck. To the bulls out there: you don’t need anyone’s good wishes.
