
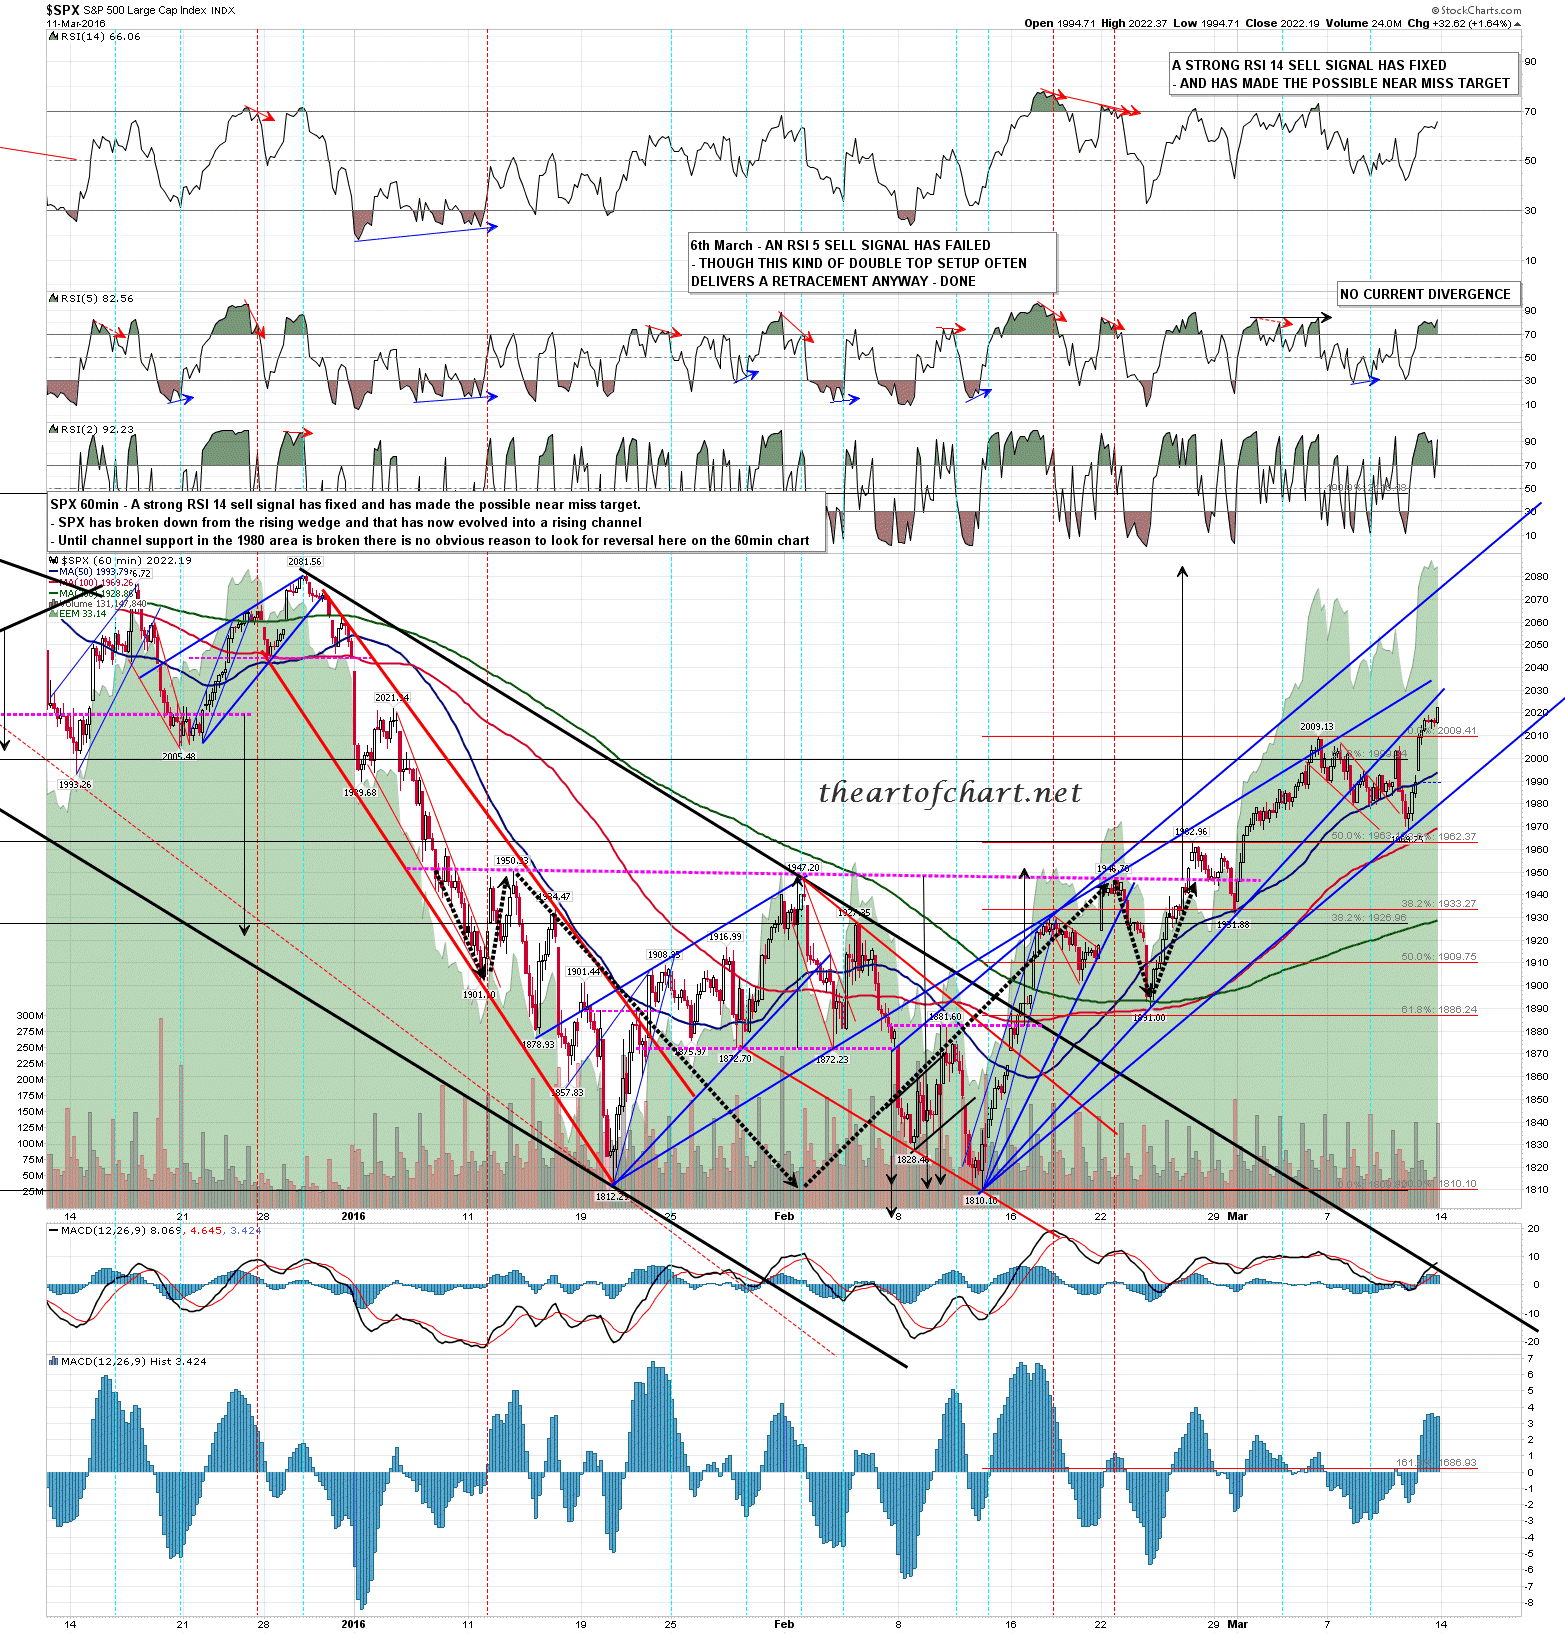
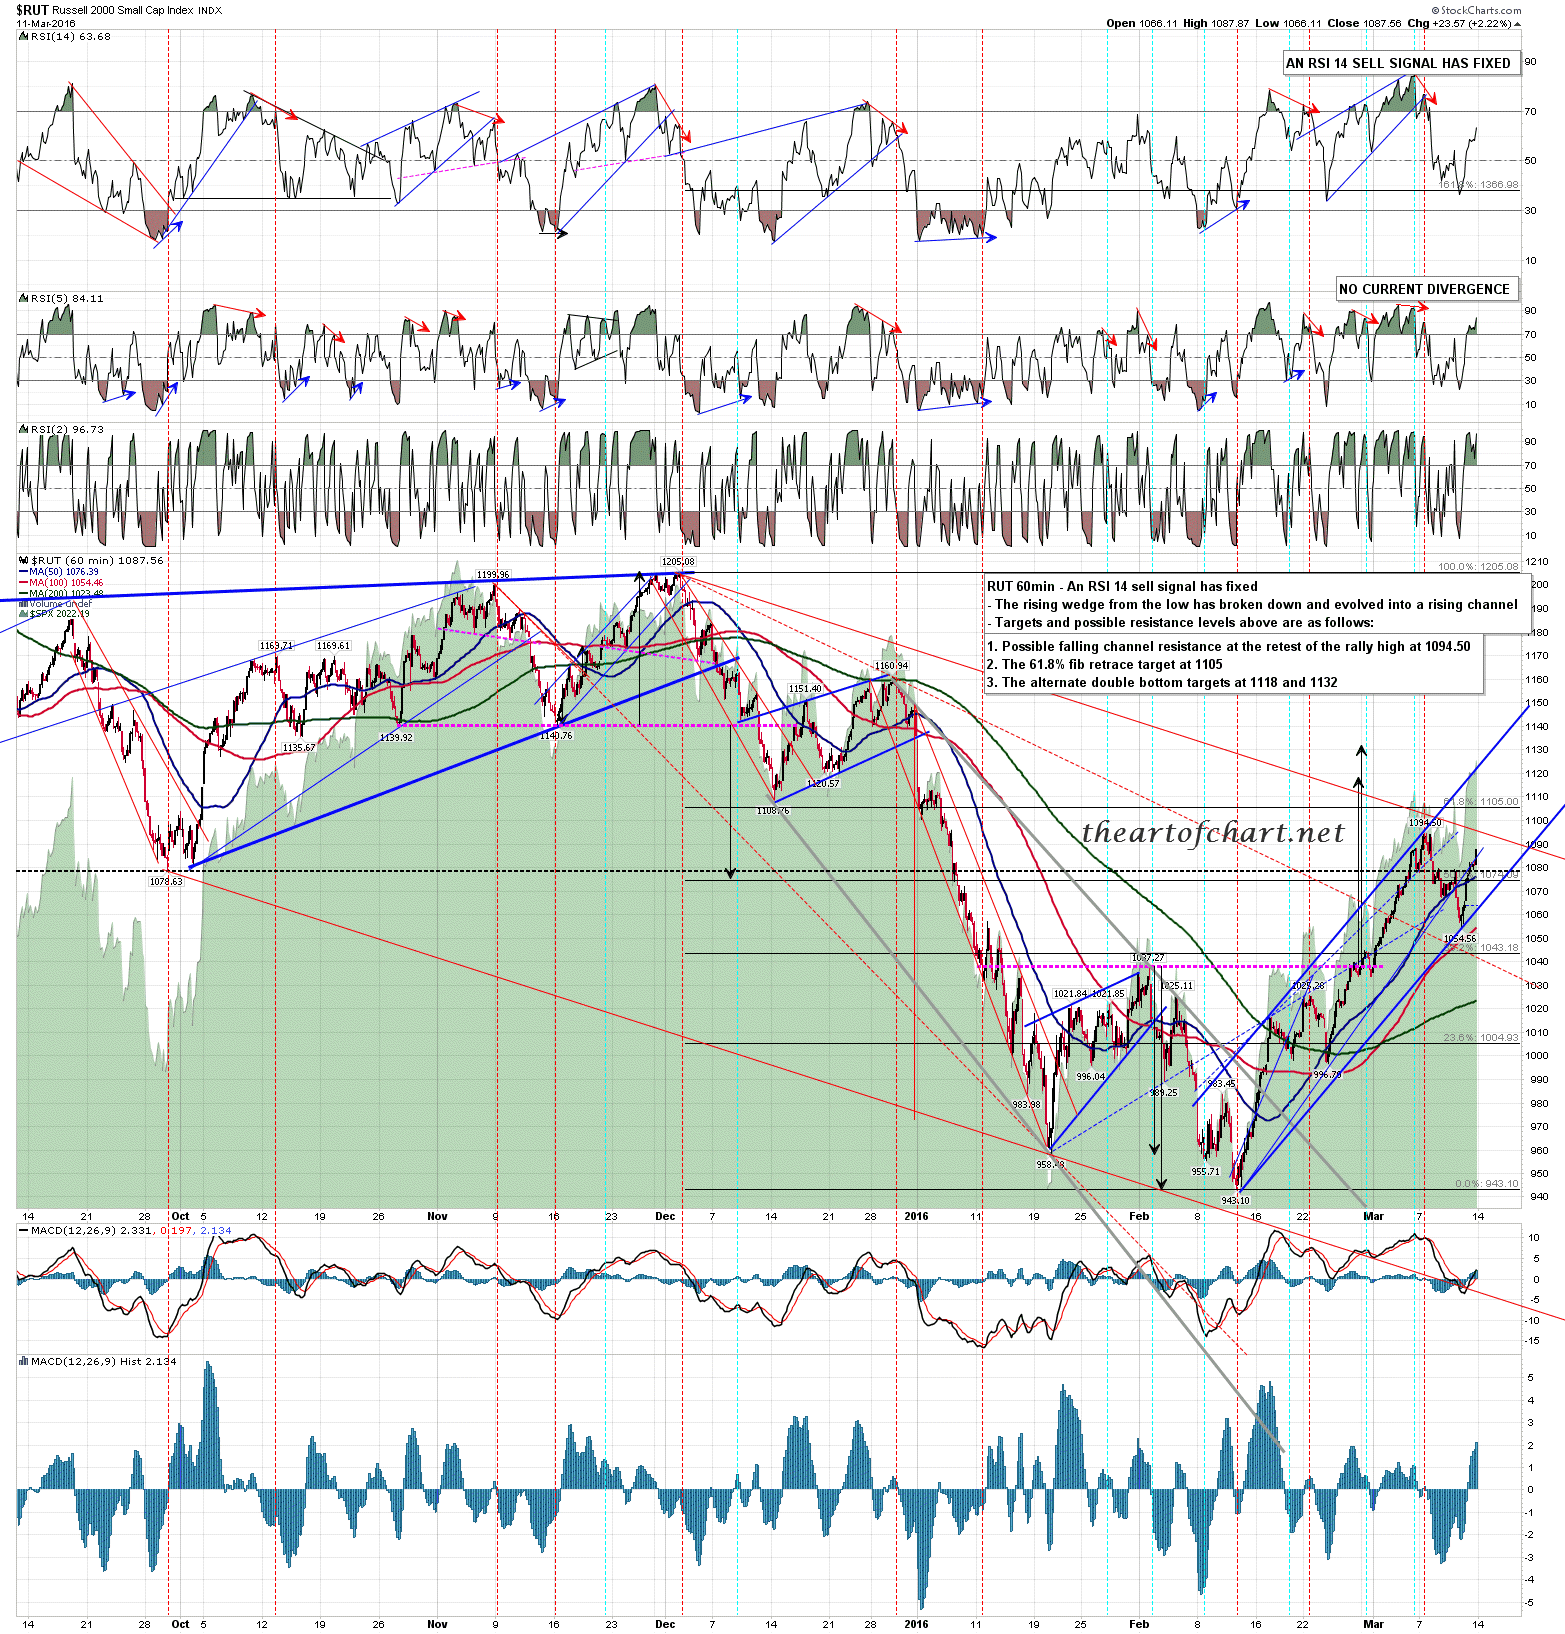
I’ve been working on various charts over the weekend and the first thing to mention today is that both of the rising wedges from the lows on SPX and RUT have now evolved into rising channels. That means that while there are still good reasons for both to reverse back down in this area, that there is no longer a pattern reason to expect either to be topping here, and on a sustained break over the current resistance areas on both, then there is another obvious target area above on both. I’ll walk through the levels on each below.
On SPX resistance here is at the 200dma at 2020, the monthly middle band at 2032, and the 50 week MA at 2033. On a sustained break above these the obvious next target area would be around the IHS target in the 2082 area, which would be a decent match with the daily upper band, now at 2075. SPX 60min chart:
On RUT resistance here is at the the current rally high at 1094.50, possible falling channel resistance from 1205 currently at the same level, the weekly middle band also at the same level, and the 100dma at 1098. On a break above this area there is a bit of possible resistance at the 61.8% fib retrace in the 1105 area and the daily upper band in the 1108 area, but the next main target and resistance cluster would be around 1150, with declining (channel) resistance from the all time high there, joined by the 200dma at 1152, and backstopped the 50 and 100 week MAs in the 1167/8 area, and the monthly mid band also in the 1167 area. RUT 60min chart:
The NDX wedge has not evolved into a rising channel and has formed a decent double top, so that supports a turn in this area. We shall see. If we are to see a turn in this area I’d ideally be looking for some retracement and then a marginal higher high that did not exceed 2035 on SPX or 1097 on RUT.
