
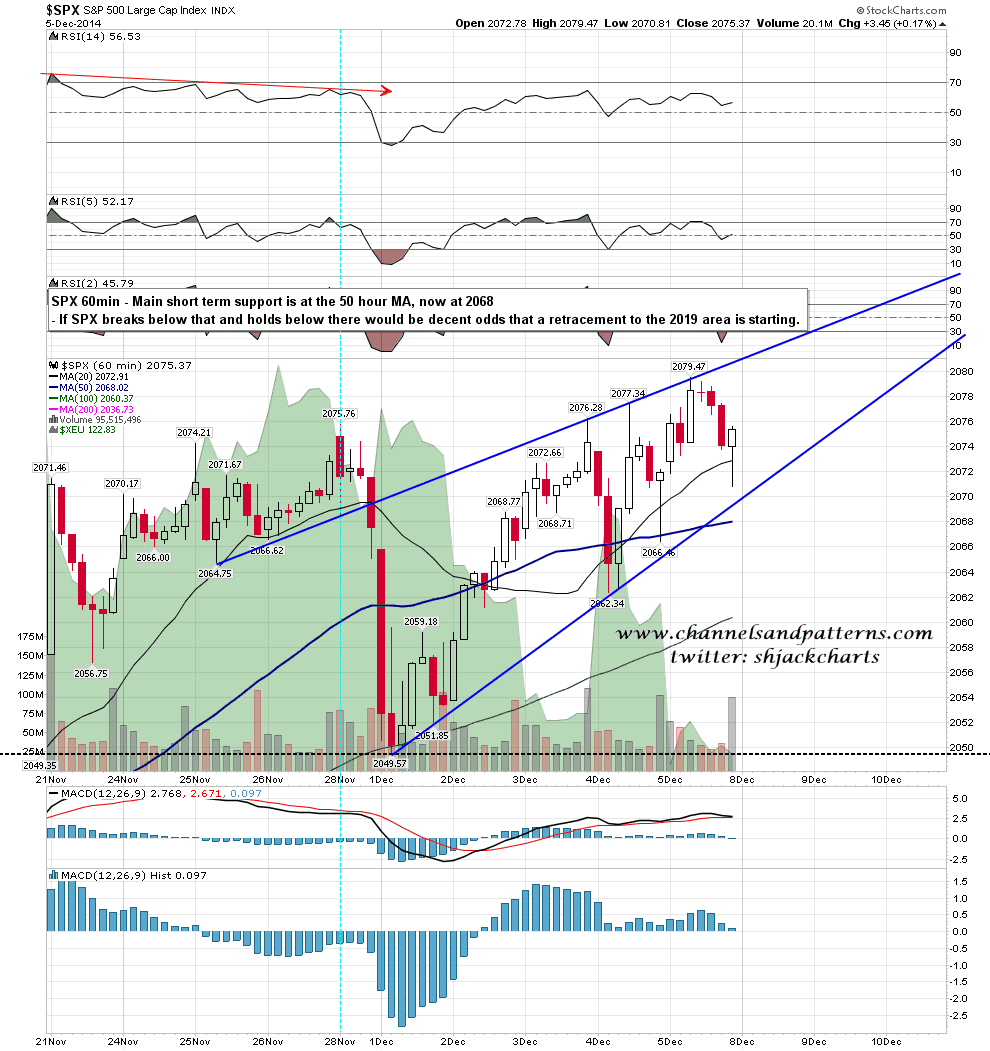
The next two days are important on the 5 DMA stats that I’ve been watching over the last few days. The previous two examples that retested the high before the break below the 5 DMA then retraced on the sixth and seventh days after the break. The break was six days ago so we shall see whether that repeats here.
By the end of Friday it was clear that the pattern from last last Monday’s low at 2049 is a rising wedge. That leans 70% bearish as and when it breaks of course, and could take SPX back to what would now be double-top support at 2049, targeting 2019 on a sustained break below that. That would be a retracement near the lower end of what we would expect to see after the end of a 20+ day 5 DMA run. A clear break below (wedge support and then) the 50 hour MA, now at 2068, should signal that a retracement has started. SPX 60min chart:
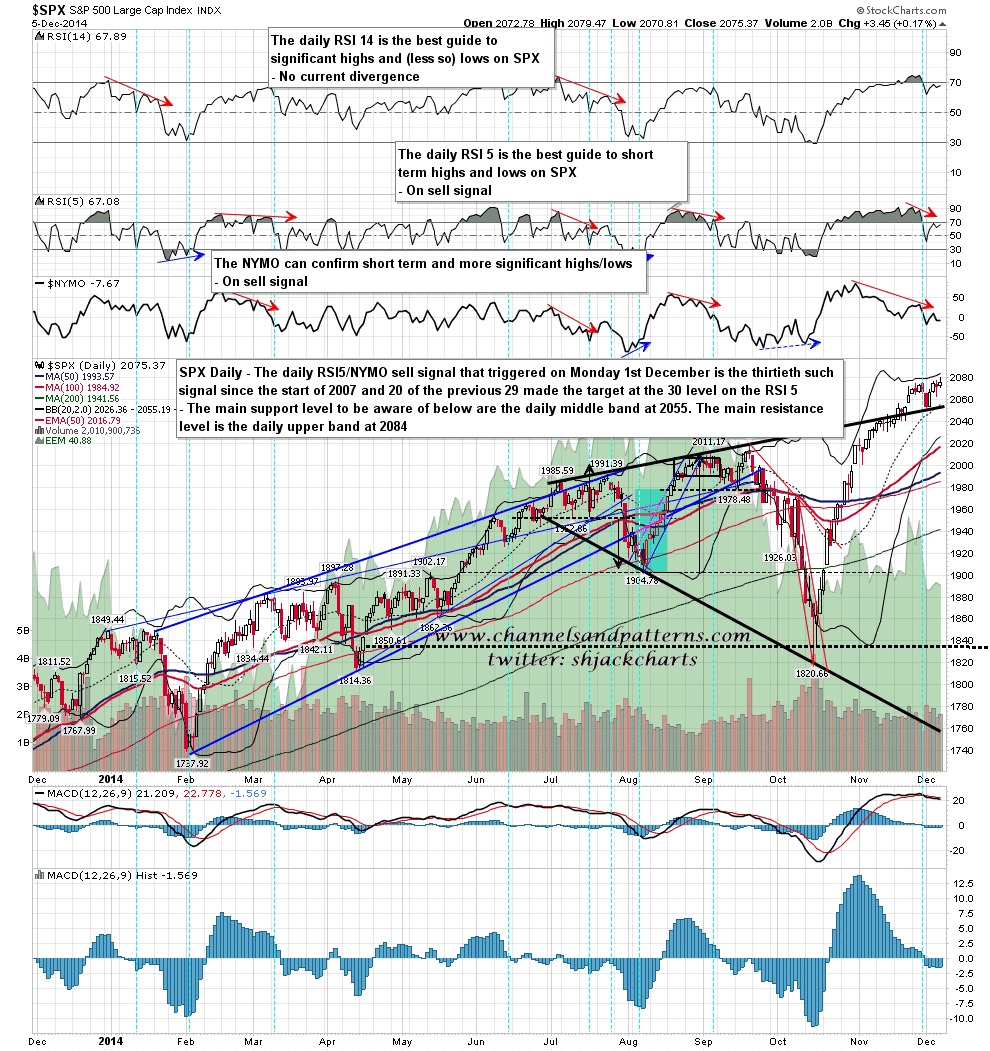
On the daily chart SPX is still on the RSI5/NYMO sell signal that triggered a week ago. First support on a break down of the short term rising wedge is at the daily middle band, currently at 2055, and resistance in the event that SPX makes more new all time highs is at the daily upper band, which closed Friday at 2084. SPX daily chart:
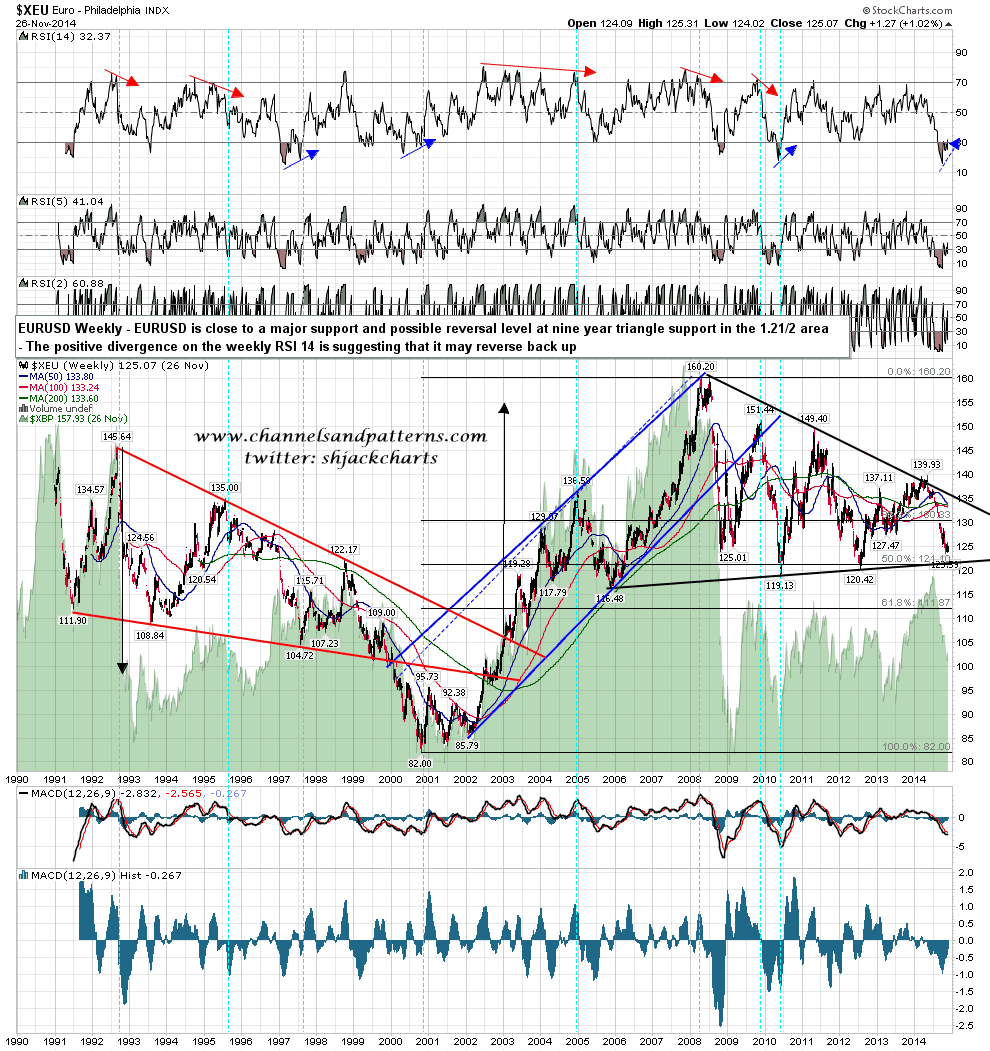
EURUSD is coming up to a very important support level and inflection point at nine year triangle support, and it’s possible that we could see a big reversal back up there. Everyone seems to be assuming that EURUSD will continue down , in significant part because of the QE that the ECB is expected to start seriously soonish, but there is a real question over whether there will ever be anything but talk of QE in Europe.
The Germans have an effective veto over any QE in Europe and the last big money-printing experiment in 1920s Germany ended in hyperinflation, collapse and played a significant role in Adolf Hitler’s rise to power. They haven’t shown any enthusiasm so far to try that again and there isn’t anything to suggest that they are in the process of changing their minds about that. Without German approval there won’t be any significant QE in Europe, and EURUSD may be a lot stronger over the next year or two than everyone currently expects. I’ll be watching this support hit with great interest. EURUSD weekly chart:
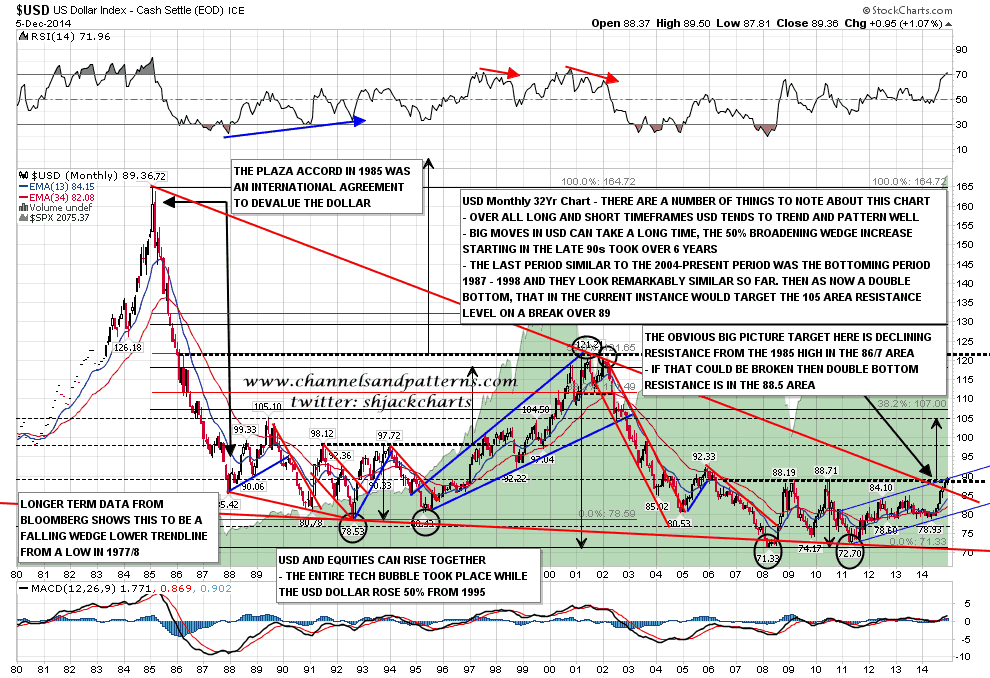
Is there anything to support a big reversal on the USD chart? Not directly, but USD has broken slightly over double bottom resistance at 89, and I’ve mentioned many times that when these patterns fail, it tends to be at this point just after the break. If this USD uptrend is going to fail before 105, the obvious level to see that failure is therefore here. USD monthly chart:
I’ll be watching the rising wedge on SPX today. I’m expecting that to break down in due course but we could see another new all time high or two before that happens. When the wedge does break down it may then retest the high in any case. A hit of wedge resistance, now in the 2081 area, should be a low risk short entry if seen.
