Slope of Hope Blog Posts

Slope initially began as a blog, so this is where most of the website’s content resides. Here we have tens of thousands of posts dating back over a decade. These are listed in reverse chronological order. Click on any category icon below to see posts tagged with that particular subject, or click on a word in the category cloud on the right side of the screen for more specific choices.

Natural Gas Ready to Rock?

By -

I have been watching this idea for a few days and waiting for a move higher to finish this potential larger WXY correction idea, this last leg up looks like a 5th wave of wave C, of a larger wave [Y].

Although simply put, its a 3 wave movement from $3.14, much similar the prior 3 wave movement from $3.07.

ye6301

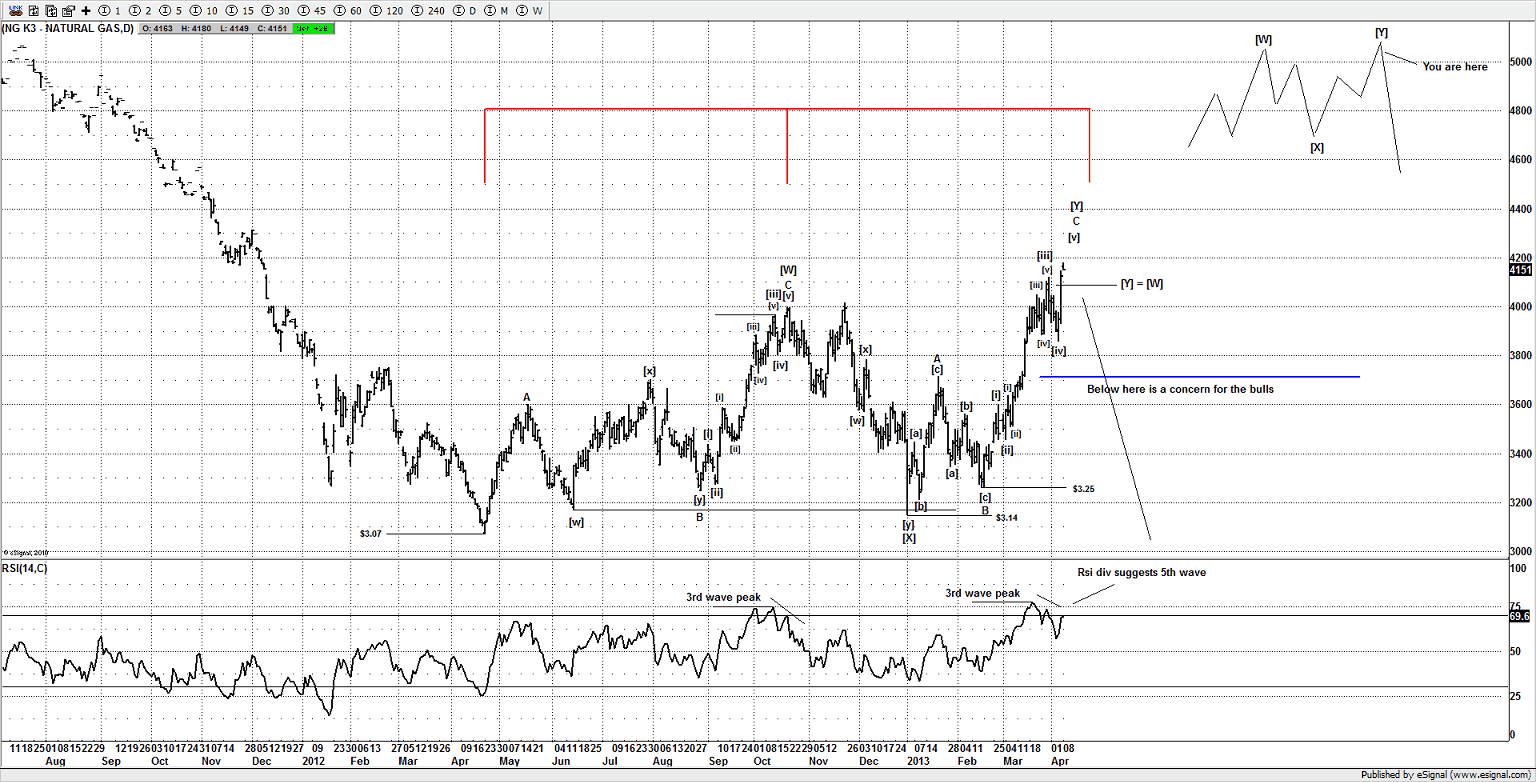
Hence its what we Elliotticians call a WXY correction. From $3.25 i suspect its now in a small 5th wave of C, so as its pushed to a new high its met its minimum objection, although the [Y] = [W] target has been met as well.

If i am correct about this idea, and i don’t see any reason why atm, then we should be very close to a strong reversal and suspect this whole advance from the April 2012 lows gets completely retraced.

But even if the larger idea is wrong, there appears to be a 5 wave advance from $3.25 nearing a conclusion, if you look at the RSI it argues for a 5th wave much like the peak into the wave [W] peak back in Oct 2012.

ye6302

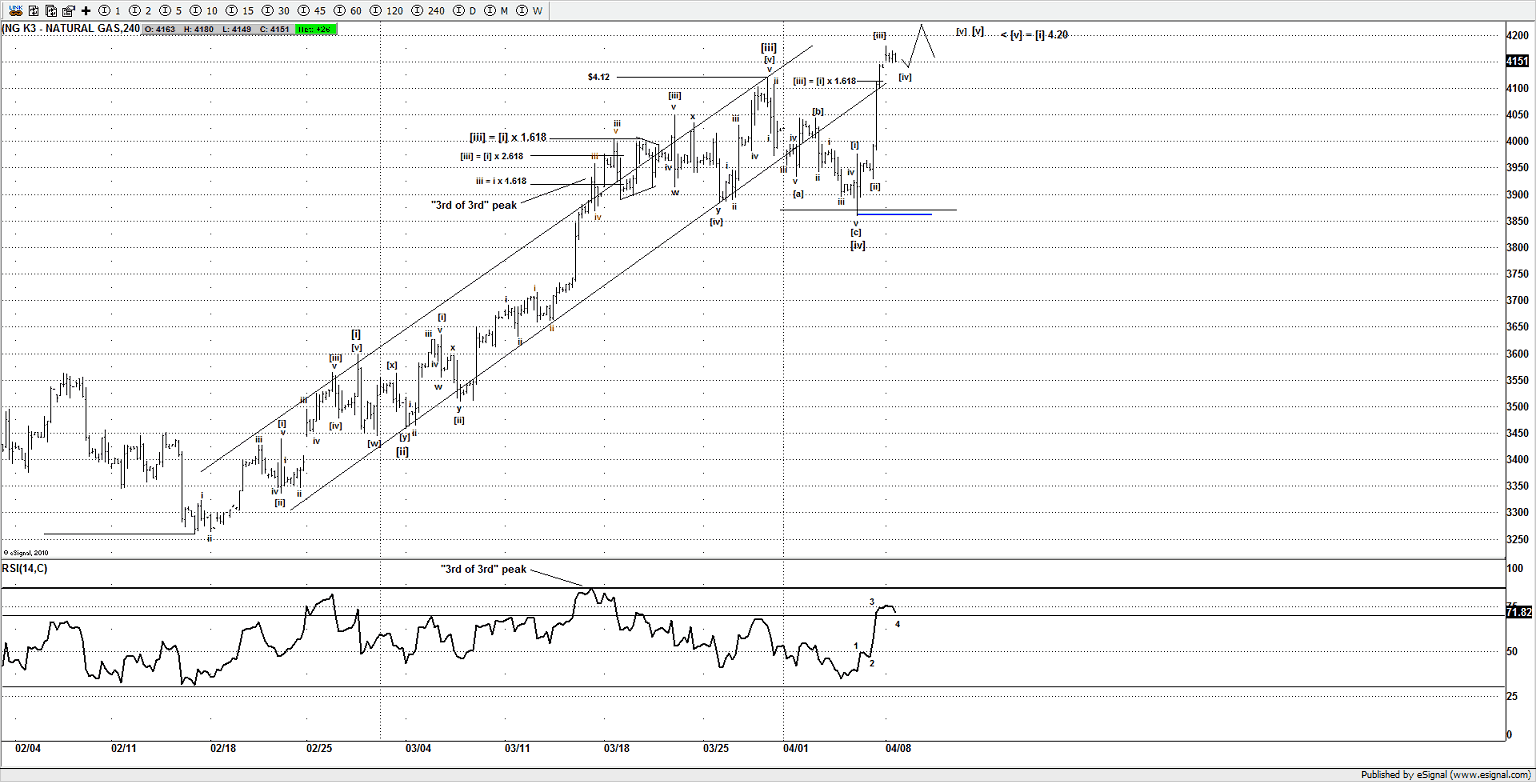
Ideally a small minor high for a small 5th wave then a strong move under $4.10 is want i want to see

I suspect there are many ways traders could take advantage of a potential reversal in this market, i personally prefer the futures market, although traders could look at options

I personally don’t know of any decent ETF, that really moves 1-1 with the price of NG, so i strongly suggest seeking out ways to trade this before you enter any trades

Waiting for the Fat Lady to Sing

By -

The rally from the Nov 2012 lows appears to be in wave 5, or i suspect it will be a 5 wave advance.

In Elliott Wave terms we call that an impulse wave, it looks virtually text book, although as its pushing higher, it still don’t look completed, I am currently working 2 ideas.

Idea 1

The market is about to push higher in a small 3rd wave of what we call a triangle “thrust”, so today should see more upside above 1581SPX, so some sort of “burst” to confirm this idea and negate Idea 2.

Holding above 1558SPX keeps the market bid, so no matter which idea, it is still bullish above that area, and short term aggressive traders can look to buy dips and use 1558SPX as the risk control point.

A potential target for the end of wave 5 is around the 1590-1600SPX, but its subject to wave structure and counting a 5 wave advance from the wave [e] point of the triangle (blue line).

Idea 2

This is the preferred idea and a potential ending diagonal (non Elliotticians call them bearish wedges).

Although this is limited to 1581SPX as above that area wave [v] would be longer than wave [iii] and that’s a rule violation for the pattern, so its actually quite simple, if a move above 1581SPX, it suggests Idea 1 and the triangle “thrust” option is working, failure to break above 1581SPX suggests the ending diagonal option.

Currently the market has not tipped its hand, but by the end of today’s close i am expecting to have some sort of edge to which idea is working.

ye6042

No matter which idea as long as its above 1558SPX the market is still bid.

I wont bore you with the daily chart idea, as that is not important, whats important is the structure appears to be a 5 wave move from the Nov 2012 lows and i suspect a reversal is close, we simply need to let the market commit and confirm which short term idea is in play.

The Case For a Major High

By -

With the “almost” new high on the SPX we are
slowly moving into my much awaited target zone of 1480-1500SPX. I have been
tracking a potential ending diagonal on the SPX and with some of the other US
markets showing similar patterns, I knew sooner or later the SPX would need to
play catch up.

As usual those that forced 3 wave declines as 5 wave moves
got run over as the markets have rallied back to test the Sept highs. For me it
was a no brainer, the European markets had exceeded those highs some weeks back
and one by one markets like the RUT, XLF, and NYSE exceeded those highs,
it wasn’t going to be long before the major indexes in the US played
“catch up”.

The DOW and the COMPQ are still behind their respective 2012
September peaks, so with approx 200 DOW points needed to exceed that Sept 2012
peak, the SPX probably pushes a bit higher towards 1500SPX.

You don’t need to be an Elliottician to notice the bearish
looking wedge shape seen in many US markets, just pull up a chart of any of the
major markets such as RUT, XLF, NYSE etc to see this shape.

Ts1

(more…)

Using Goldman and JP Morgan to Predict Turning Points

By -

A couple of stocks I like to follow are GS and JPM to
forecast pivot turning points in the US stock markets, particularly the SPX.

You can see how JPM and GS appear to be tracking the SPX
well and that it’s my belief that if we can track potential Elliott Wave counts
in both Goldman and JPM,we can find an edge to the US markets and use that
information to forecast major peaks and turns in the US stock markets.

If you overlay SPX, GS and JPM with each other, there is
a clear bonding between the 3 markets.

Tim1

(more…)