<shameless plug>The following was available to Evil Speculator subscribers over the weekend. Unlike other subscription blogs Evil Speculator has been shifted towards a hybrid system in which important analysis and trade ideas (i.e. symbols, setups, etc.) are available to subscribers first but are later opened to a general audience. If you are 'evil speculator curious' drop by for a visit anytime – we're up to no good on a constant basis.</shameless plug>
Alright, let's dig right in:
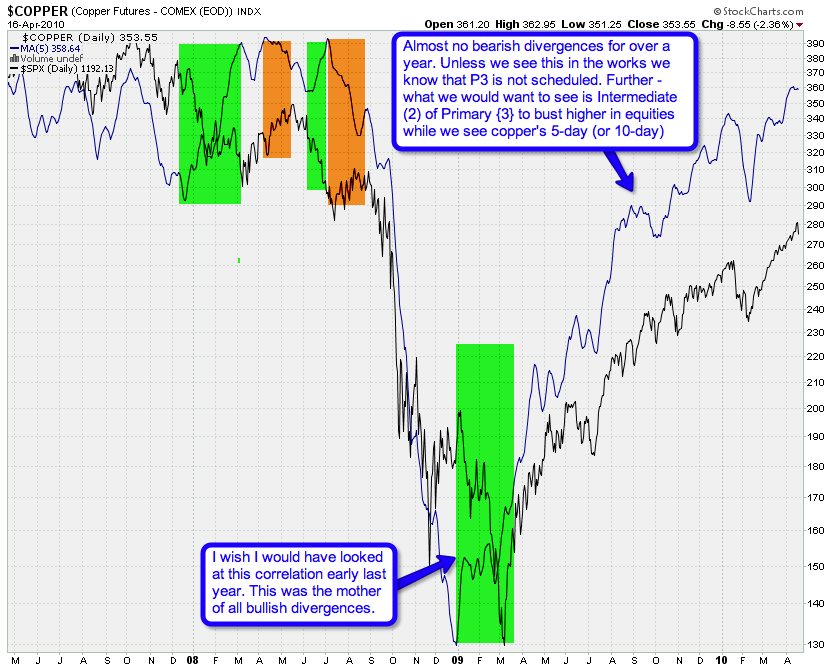
We are thinking long term here. This is my radioactive fusion
powered 5-day MA Copper/SPX chart. The MA is on the Copper futures and
what we are looking for are long term divergences. Yes, long
term – the short term is way too noisy for me to attach any
interpretations. Quite salient is the ‘mother of all bullish
divergences’ in March of 2009. Wish I would have seen this one back
then as it would have helped in assessing the timing of the finale of
the trend.
But wait – there is more. Let’s project forward a little and
consider what ‘may’ happen if we get something that may look like the
onset of Primary wave {3}. After the first major drop we would a see
snap back into Intermediate (2) – which should not be confirmed by the copper futures.
Remember – we are looking for divergences in the scope of Primary or at
least Intermediate degree moves. Anyway, it’s a good theory – for now –
let’s keep an eye out and put it into context along with some of the
other charts I’m peddling here.
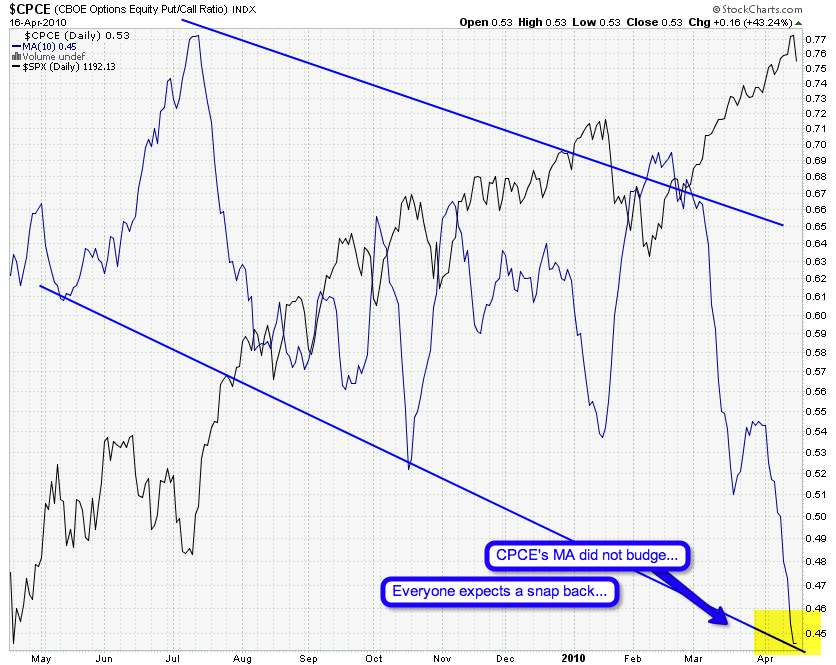
That’s this week’s shock and awe chart – I’m shocked that
the CPCE’s 10-day SMA did not budge after Friday’s drop. My take – the
bulls see this as nothing but yet another dip buying opportunity. Well
– we shall see shortly.
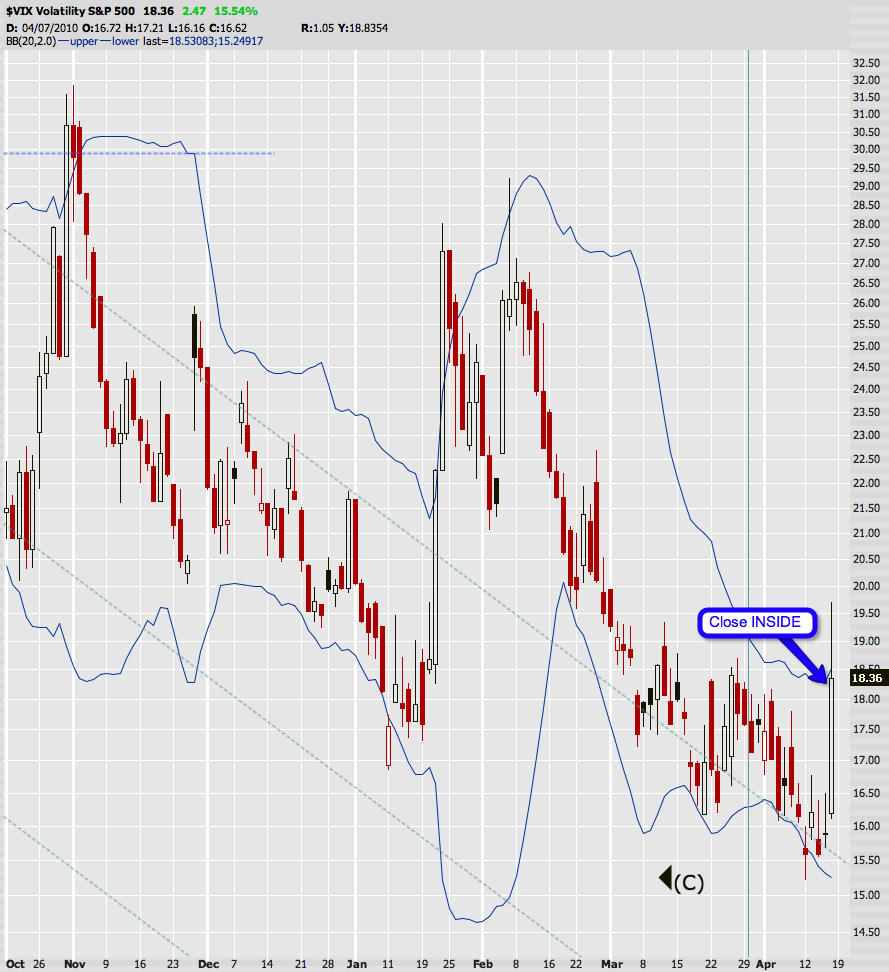
During Friday’s session got dangerously close to busting outside the
upper border of the 2.0 BB on Mr. VIX. Fortunately we did close inside
– meaning no buy signal (yet). Doesn’t mean we won’t get one though –
IMNSHO we might see a repeat of what happened late January.

I’m no P&F pro but that upper trendline I pointed out last week
seems to have served as resistance – thus far. If we get a drop to
1,180 on the S&P 500 cash index this chart would show a first
circle as a possible beginning of a downtrend. Not sure if that is a
‘confirmation’ of a reversal but it does count and becomes part of the
chart, so let’s just go with that unless we hear otherwise from a
P&F pro. I have highlighted the 1,180 mark on my wave count below
as well:
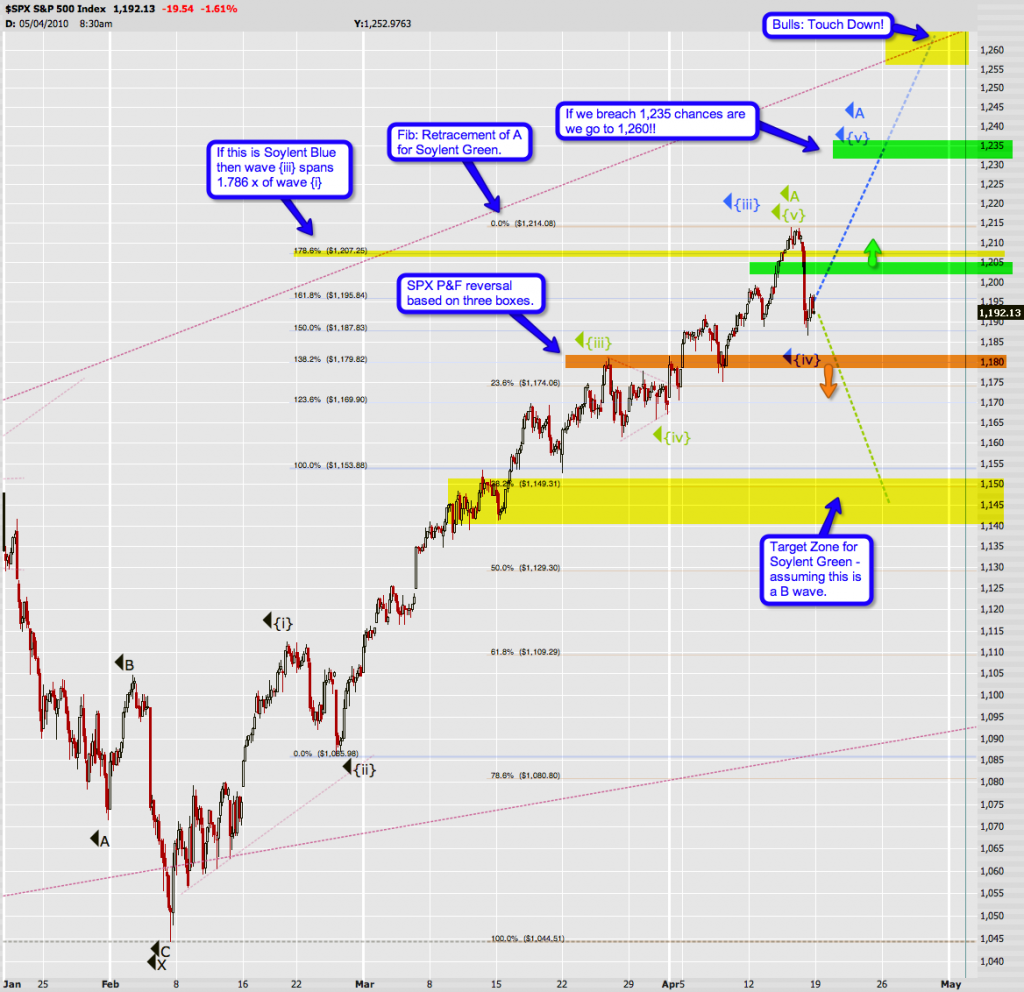
You might want to open this one in a separate window/tab by clicking
on it – it’s got quite a lot of detail. I won’t repeat all my comments
here but suffice to say that I have a feeling that things are slowly
shifting back into focus now. The retracements all line up quite nicely
and we might just have ourselves a map here.
Soylent Blue means that we are either done with Minute {iv} or will
be by around 1,180 – that P&F reversal point I highlighted above. I
postulate that we may bounce a bit before that and keep it off the
P&F chart – but that’s just a theory. If we keep dropping through
that point Soylent Green becomes a lot more realistic. The target for
Green is the 1,145 cluster as we are near a respectable fib lines, i.e.
38.2% on the way down and 100% of {i} on the way up. That’s right – I’m
the tamer of ferocious fib lines – Siegfried & Roy have nothing on
me 
Some other comments on the chart – I think it’s a decent map – keep it handy as next week unfolds.
Cheers!
Mole

