There was a very interesting stat I saw yesterday that’s worth a look, and you can see that here. It’s looking at the big moves up from the low, and the stat is a good illustration both of the power and the danger of these sort of stats. I don’t disagree with the stat at all but I’m going to do a post at the weekend pointing out important details that can be missed on stats like these, notably in this case that a number of these instances were just before big declines. The stat does however support Stan and my main scenario here, which is that the final bull market high is not yet behind us but still ahead. I’ll talk more about that in my weekend post as well.
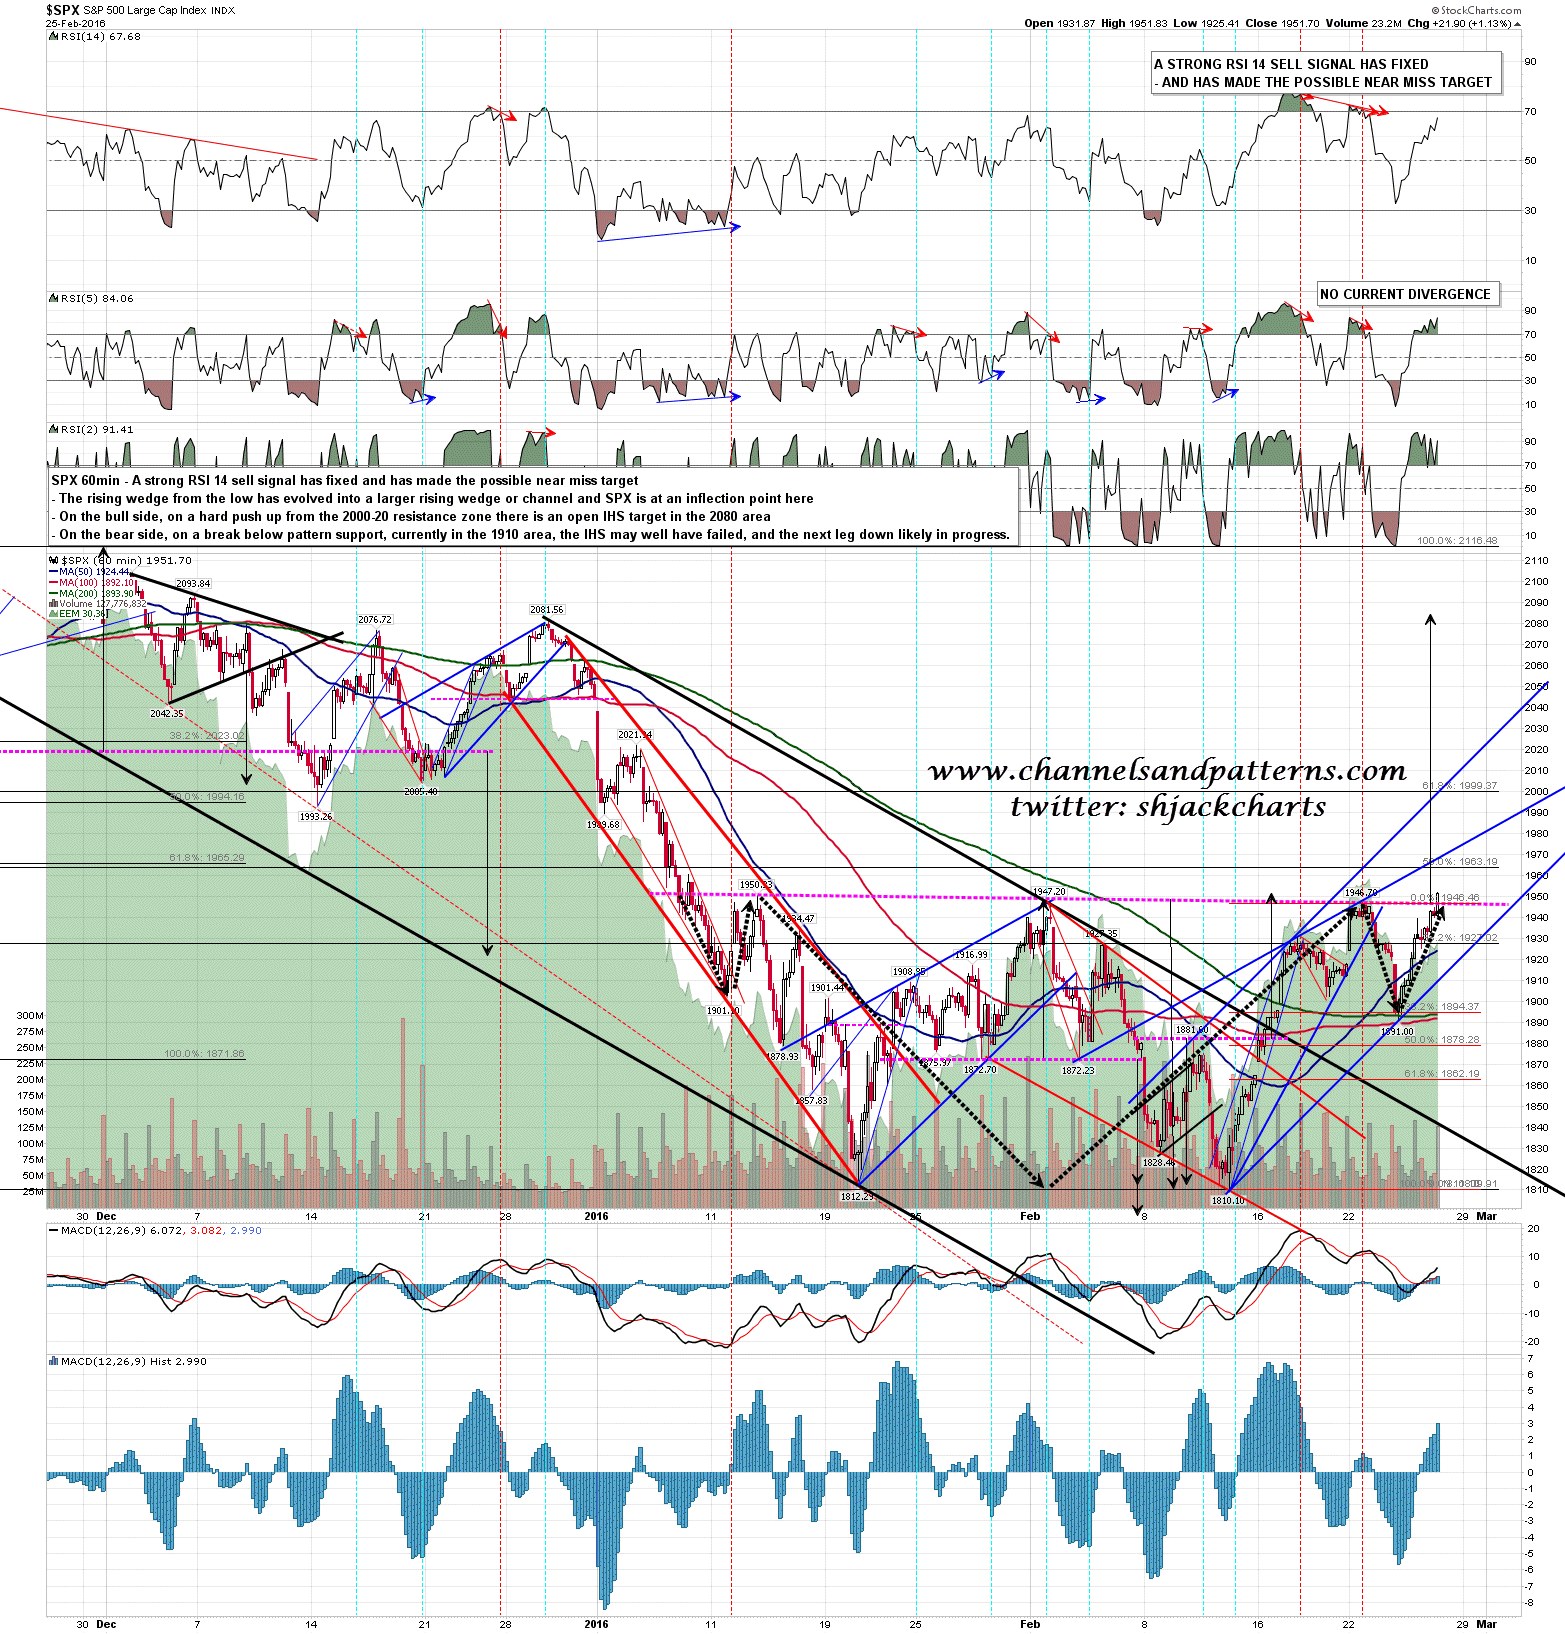
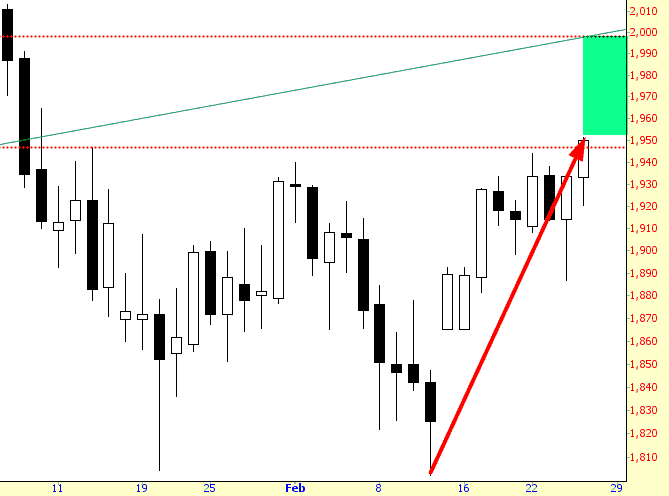
Back in the short term SPX has now broken up from the IHS that I was looking at yesterday with a possible target back in the 2080 area. Does that mean that the bulls are back in the saddle? Not yet no, as when these patterns fail they tend to fail just after the break up, which in this instance would be here and now. I’m watching to see if that happens here. I have resistance at the 50% fib retrace target at 1963, and wedge resistance currently in the 1970 area. If we see a break back below wedge support, currently in the 1910 area, then the odds will be good that the IHS is failing and that a new leg down has started. SPX 60min chart: