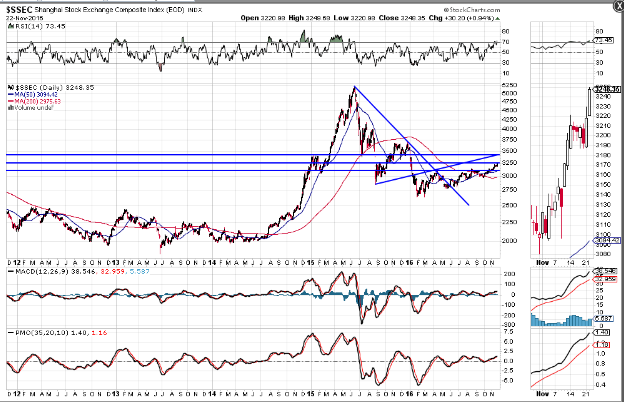
I last wrote about China’s Shanghai Index (as part of a comprehensive review of major world markets) on January 29th. Since then, and, until June, the road to recovery from its lows of the year has been volatile and rocky. The last half of this year has seen a fairly steady, if choppy, advance to its current level just below its next resistance level of 3250, as shown on the following Daily chart.
In that post, I had mentioned that a rally to (and hold above) 3000 could thwart a major downdraft, as was being threatened by an imminent break of a neckline of a massive Head & Shoulders formation.
A break and hold above 3250 could see price continue to rally to its next resistance level around 3400-3500. This index is trading under the bullish influences of a moving average Golden Cross, so a break and hold above 3250 is critical to continued success of further advance; otherwise, a drop and hold below that level could very well see a major bear attack ensue, sending price to new lows of around 2500, or more.
In my above-mentioned post, I also made the following conclusion (relative to world markets):
“In particular, watch Japan, China, Brazil, the Russell 2000 and the Nasdaq 100 Indices for committed leadership…” related to any real success or failure of the S&P 500 Index and equities, in general.
As noted on the following 1-year Daily charts of these indices, they’ve all risen above major consolidation/congestion levels this year, with the exception of the Nasdaq 100…the one to watch, along with the Shanghai Index, to see whether their movements (either strength or weakness) influence, or have an impact on, the other indices in the days and weeks ahead.


