
Apologies for the late post today. My wife has been unwell and I’ve been juggling various priorities today.
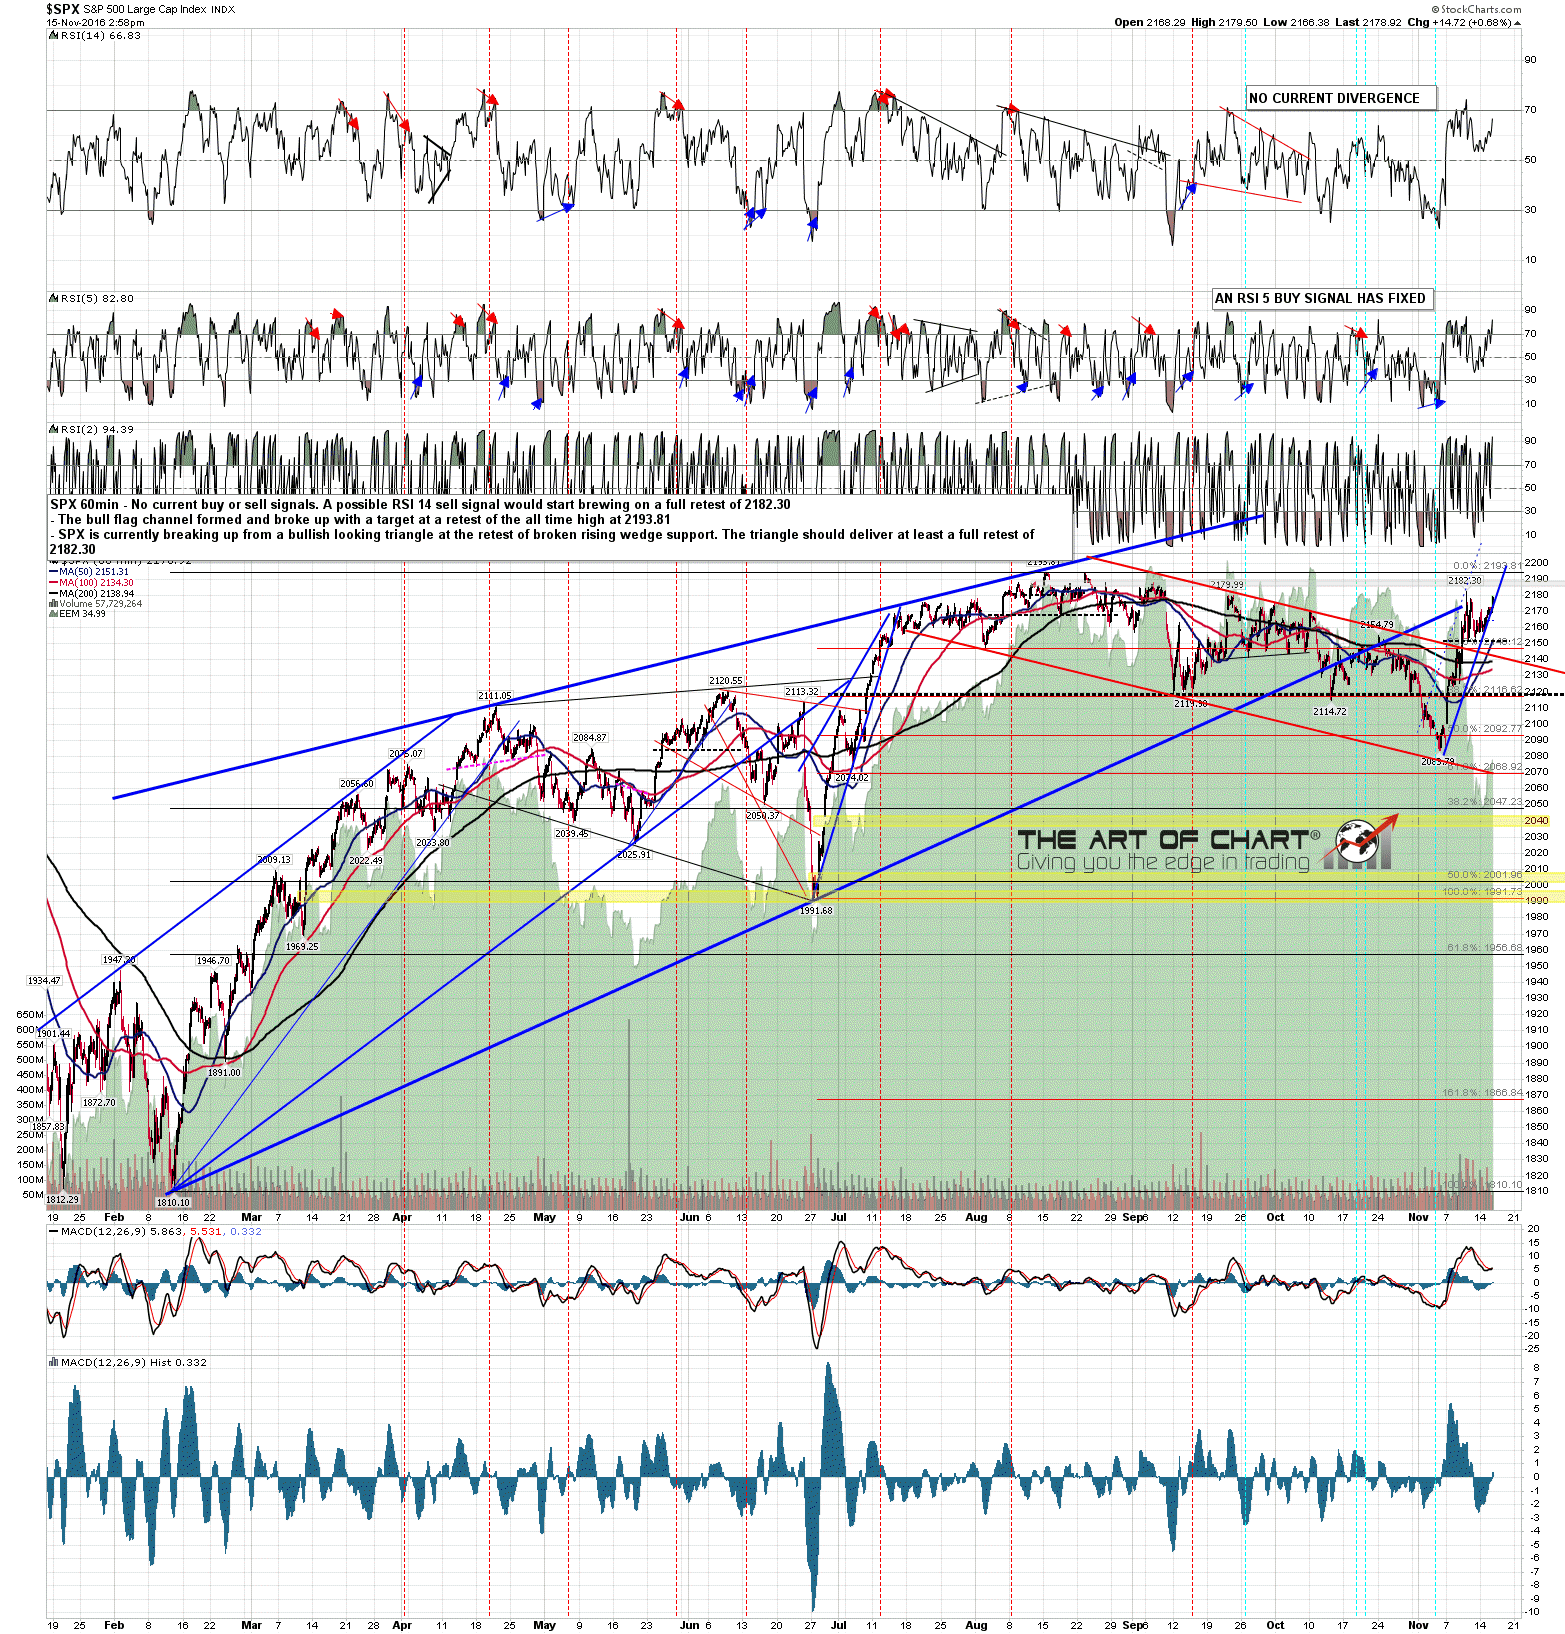
SPX has spent the last couple of days forming triangles on both ES and SPX and the triangles have now broken up. This should deliver at least a retest of the current swing high at 2182.30 and when seen that will set a possible 60min sell signal brewing. It could reverse there, though my lean would be to then see a retest of the all time high at 2193.81, as I also have a larger fixed flag target there. Hopefully by then the current move will be better defined with an identifiable pattern. SPX 60min chart:
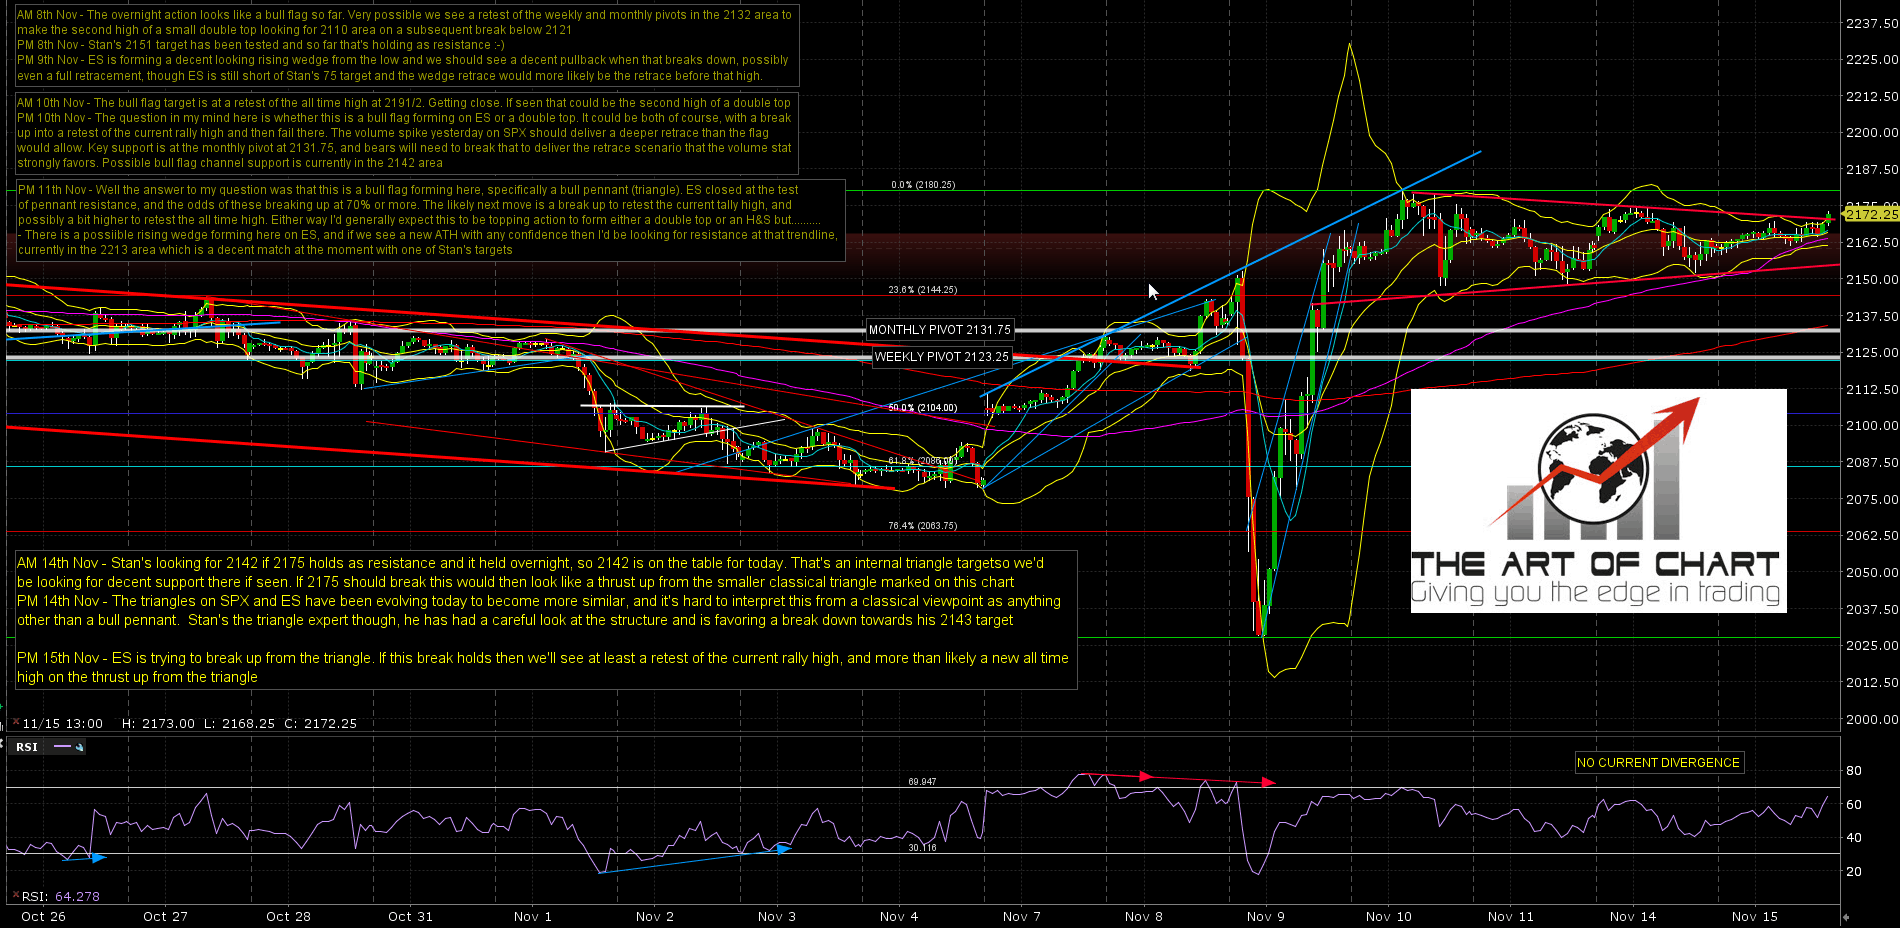
ES Dec 60min chart:
Now that the triangle has broken I’ll be sifting through the SPX/ES, NDX/NQ & RUT/TF charts tonight looking for patterns and trendlines & I’ll be reporting back on that tomorrow. Until then this is is all still fairly amorphous in terms of the trendline/pattern setup and I’m keeping an open mind.
