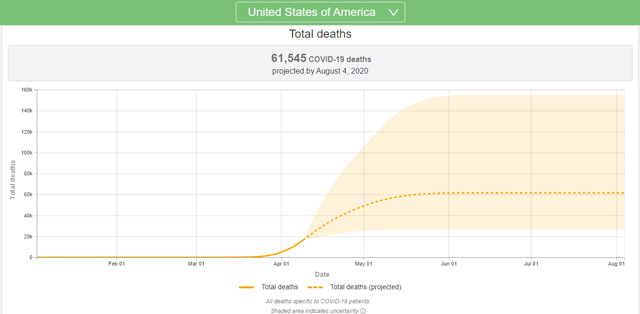
Screen capture via the Institute for Health Metrics and Evaluation.
(more…)Slope initially began as a blog, so this is where most of the website’s content resides. Here we have tens of thousands of posts dating back over a decade. These are listed in reverse chronological order. Click on any category icon below to see posts tagged with that particular subject, or click on a word in the category cloud on the right side of the screen for more specific choices.
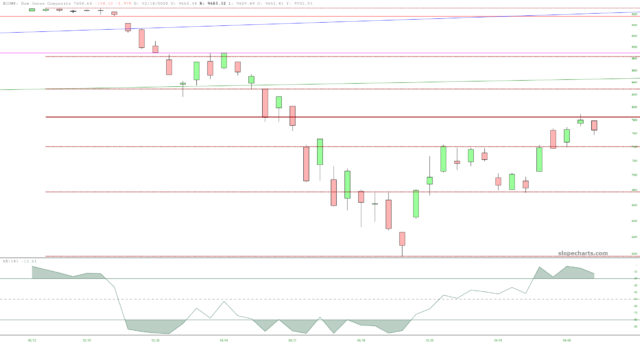
Below is a walk-through of eleven important cash indexes. In every single one, I have applied the Williams %R indicator (14 days), and the 50% retracement from the Fibonaccis is shown as a bold horizontal line. The only exception is the Russell 2000, whose line is at 38.2%. Please click on any chart for a larger view and to see the symbol/name in the upper left.

In the Sudden Slope Sentiment Shift post from late last week, I stated that of the cancellations I had received on April 9th (which seemed to be some kind of “Max Pain” point for people), all but one stated their reason as something along the lines of, “It’s not you, it’s me.”
There was one exception, however, and he stated, in its entirety, the following:
150% short get’s us all excited only to find out that night on Closing trade you covered…you\’re a day trader who shows longterm charts…should have waited until the price hits 50day to short….killed me
I thought this merited a response, because I must strongly disagree with the characterization of myself as a “day trader.”
(more…)