I’m sure most people have not noticed this and may even roll their eyes at it because apparently we shouldn’t do technical analysis on the VIX.
I say, if it works, use it.
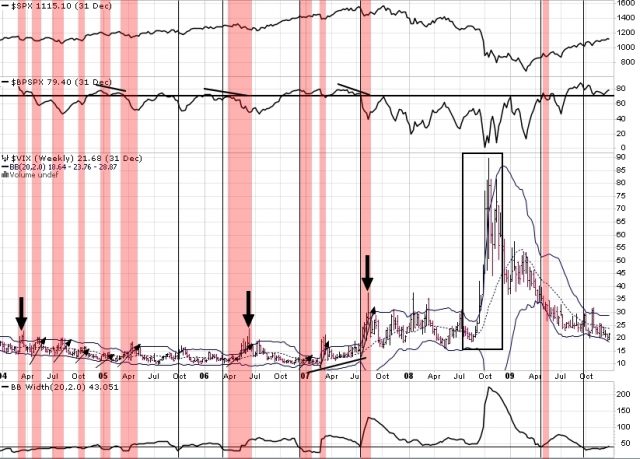
Personally, I use bollingers on the VIX and find them helpful. A recent observation,however, is what prompts this post. Specifically, that when the weekly bands get about as tight as they ever do, the probabilities of a weekly upper bollinger touch increase significantly and the chances of a weekly upper band overthrow (as what happens in crash-like moves) have a much higher chance of occurring. It appears to me that this forewarned of a potential serious depreciation for nearly every major drawdown over the entire timespan (nearly 25 years). It missed the major declines in the 2008 bear market as the weekly bollingers only squeezed to around the 50% mark, but I feel an adept trader could make this work as well.
I went back to 1998 for this study encompassing two bear markets and two bull markets. The information I’m going to share may work even better as a volatility play rather than a short index play if you can find a way to do it relatively safely (I’m open to suggestions if anyone has some ideas as I don’t play VIX futures or options as yet).
First, the criteria. I set the limit at 40% (the bollingers are 40% of the value of the 100day average of the closing price). When the bollingers get below that threshold, hypothetically the chances of volatility expansion increase. Admittedly, sometimes IMPLIED volatility gets low and stays low for extended periods. I found that using a BPI sell signal as the entry criteria worked best to capture the swing to the upper band. It jumped on board just as evidence that lows were beginning to give out by creating point & figure sell signals. This caught the start of the wave as it builds. The safest exit was at the weekly upper band. Personally, I would likely sell half a position at the upper band and hold the rest on a trailing stop in case of a blow out (the plan may need to vary depending on the trading strategy or option strategy chosen, of course).
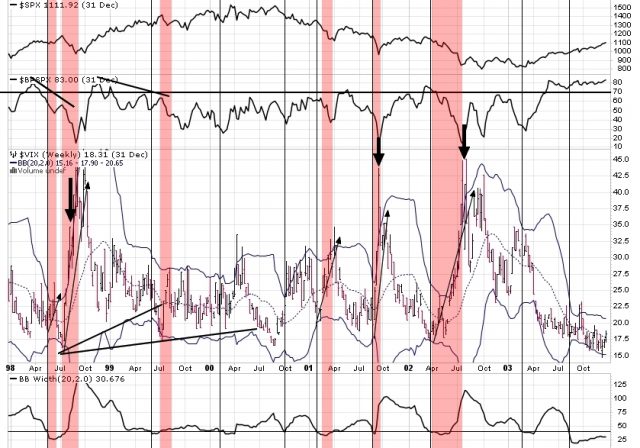
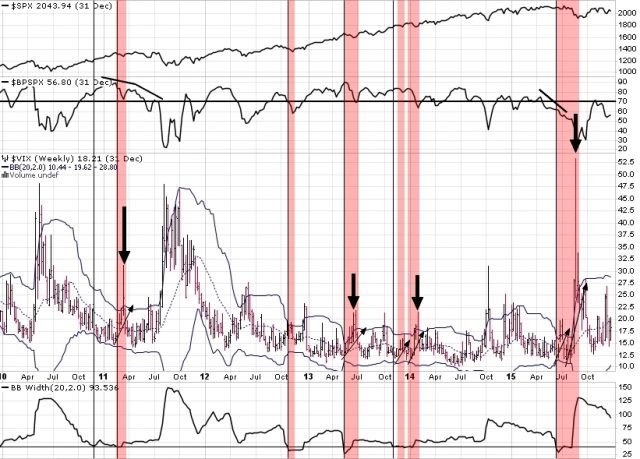
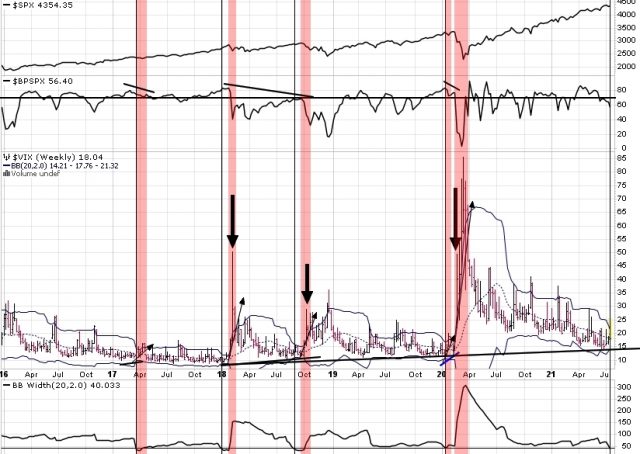
Now for the charts. I’ve marked a thin black vertical line when the bollinger width crossed below 40. Then I have highlighted red when the Bullish Percent Index starts to turn down. See for yourself how it worked out.
The trade works best when the VIX is below its 20 WEEK moving average and has room to run. I have marked what I consider to be the more serious declines with large bold arrows.


I think the major point here is to not hold on for the overthrow every time, or better yet, have a plan for it as I suggested above leaving room for both scenarios. A falling BPI is a great hedge/sell signal on its own especially when below 70% as it is now.
As of today, the weekly band sits at 38.315% so the scenario is in play.
If the BPI rolls over, buckle your seatbelts, it could get a bit wild.

