
I’m often asked, “What’s the best stock for credit spreads?”
I’m dumbfounded by the question because it would require me to have a crystal ball, and unfortunately, my crystal ball broke decades ago. So, I can’t answer the question with any accuracy. And it’s exactly why I take a purely statistical approach to the market.
However, I can tell those that ask how to find the best stock for credit spreads, or any options selling strategy for that matter, using the following process.
1. Liquidity
I only trade stocks with highly-liquid options. It just doesn’t make sense to trade illiquid options. There are far too many drawbacks. But the primary drawback is pricing inefficiencies. Basically, you are going to get poor pricing across the board—at the open, any adjustments, and the closing of the trade. It just doesn’t make sense from an efficiency standpoint.
There are roughly 3,200 tradable stocks with options and approximately 11.5% have medium-liquidity while just over 3% have what is considered high-liquidity. So, in my book, only 14% of stocks with options are truly “tradable.”
Once I know a stock has highly-liquid options I look at three different volatility measures: current implied volatility (IV), IV Rank and IV Percentile.
2. Implied Volatility
All stocks have unique implied volatility ranges. I always look at the current implied volatility (IV) of a stock, as it states the expected volatility (movement up or down) of a stock over the life of the option (specific expiration cycle). Don’t confuse that with historical implied volatility, which looks towards the past. Knowing the current IV gives me a good idea on how much premium I should expect to receive.
But knowing the current implied volatility doesn’t tell us everything. We need to know how the current level of implied volatility compares to past levels. Otherwise, we are clueless if volatility is either inflated, at historically low levels or somewhere in between. And it’s imperative to understand where current implied volatility falls on a historical basis because we are then able to choose the most appropriate options strategy.
High Implied Volatility – Options Selling Strategies
Low Implied Volatility – Options Buying Strategies
Thankfully, there are a few numbers we can look at to give us a sense if the current IV of a stock is inflated or not: IV rank and IV Percentile.
3. IV Rank
IV rank is an important tool when measuring the current levels of implied volatility in a stock. The volatility measure tells us if the current implied volatility is high or low compared to levels of volatility over the past 12 months.
For all the options geeks out there (like myself), here is the calculation.
*IV Rank = 100 x (current level of IV – 52-week low in IV) / 52-week high in IV – 52-week low in IV)
An example of IV rank would be if Apple (AAPL) has had an implied volatility ranging from 40 to 60 over the past and the current IV is 50, well, the IV rank would be 50%.
Again, knowing how the current level of IV stacks up with the past 12 months gives me a good idea as to what options strategy I would prefer to use.
4. IV Percentile
IV percentile is another important tool for measuring how the current level of IV compares to historical levels. IV percentile measures the percentage of days over the last 12 months that the IV was lower than the current IV.
Again, a calculation for all the options geeks out there.
*IV percentile = number of days IV was lower than current IV/262 (number of trading days over the past year)
So, for example, let’s say Apple (AAPL) currently has an IV of 40, and the IV Percentile is 70%. This means that implied volatility has traded below 40 70% of the time over the past year.
As I stated before, and it bears repeating, knowing how the current level of IV stacks up with the past 12 months gives me a good idea as to what options strategy I would prefer to use.
5. Expected Move or Expected Range
The expected move is the amount a stock is predicted to advance or decline from its current share price, based on the security’s current level of implied volatility over a specific period of time. The expected move vacillates, in real time, based on changes in a security’s price and its implied volatility.
Simply stated, the expected move shows us the future expected range of a security over a specific time frame.
Let’s take a look at a quick example.
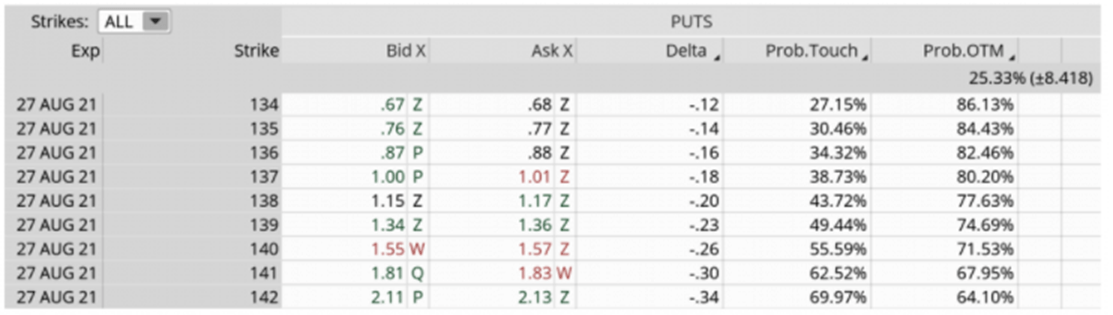
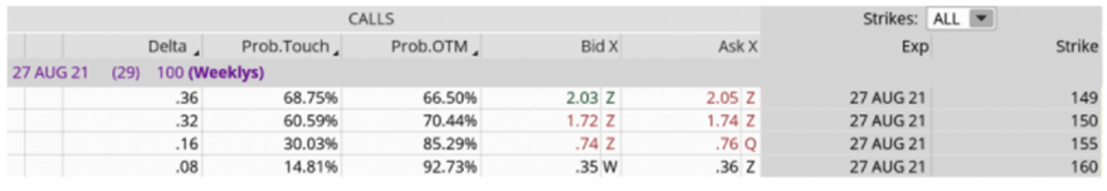
Below is an image of the August 27, 2021 options chain for Apple (AAPL) with 29 days left until expiration.
The vertical, tan-colored bar represents the expected move for the expiration cycle. The current range is between 139 to roughly 152.50. The market is essentially telling us that it expects AAPL to close somewhere between 139 and 152.50 at expiration. Having this information prior to placing a trade is incredibly valuable, as again, it allows us to use an appropriate strategy.

Now that I have a firm grasp on where implied volatility stands and the expected move over the next 29 days, I know which strategy to use.
6. Strategy of Choice
My preference is to use options selling strategies with a high probability of success.
I’m always looking for the best opportunities to sell options. Those include selling puts, selling call and put vertical spreads, iron condors, jade lizards, strangles, covered calls, butterfly spreads and poor man’s covered calls, to name a few.
But when volatility is low, I look to use options buying strategies, which is why understanding the current level of volatility and what it means is pertinent if you wish to be successful over the long-term.
One thing is certain, volatility plays a major role in choosing the best stock for credit spreads.
7. Probabilities
Once I have a strategy in mind, I can then start to look at potential strikes for a trade.
Since I am a quant-based options trader, I always use probabilities to lead my decisions. Knowing the expected move, I can then base my strikes on specific probabilities. I prefer choosing probabilities with a 68% to 85% probability of success.
Let’s say that I want to trade a strangle around the expected move in Apple (AAPL).
The expected move on the downside is 139. As a result, on the put side I want to choose a strike that’s below the expected move, say the 137 put strike with a probability of success just over 80%.
The expected move on the upside is 152.5, so let’s say we choose the next out-of-the-money strike, in this case the 155 call strike with a probability of success just over 85%.
Basically, you have the ability to know your odds on the trade before you even place it.
Understanding the risk-reward of the trade allows you to not only choose your own return, but also to manage your risk more effectively through the use of proper position size. Maintaining a disciplined approach to risk management allows the law of large numbers to play out and, ultimately, that should be our goal as statistically-based traders.
So, to answer the question, “What’s the best stock for credit spreads?”, follow the aforementioned seven step process and you will be well on your way to finding the best trading opportunities the market has to offer.
Click the following to sign-up for:
If social media is your thing follow me on:
Kindest,
Andy
BONUS NOTE FROM TIM: A reminder of some of the tools here on Slope to help with the above!
- Backtesting Strategies
- Earnings Date Charts
- Explorer
- IV Rank
- OptionDots
- Payoff Analyzer
- Price Cones
- Reaction Graph
- Strategy Guide
- tastyworks brokerage
- Trade Machine Pro
- Virtual Trading Simulator
- Volatility Calendar
- Volatility Charts
- Volatility Matrix
