Today’s market is in a straight to the point kind of mood, so I’ll get right to it. $XLE is currently trading at 81.24. I expect it to trade down to 57.60, the October 2021 POC, by November of this year. That would be a 29% gain if you shorted $XLE from here. Let’s take a look as to why I expect that outcome.
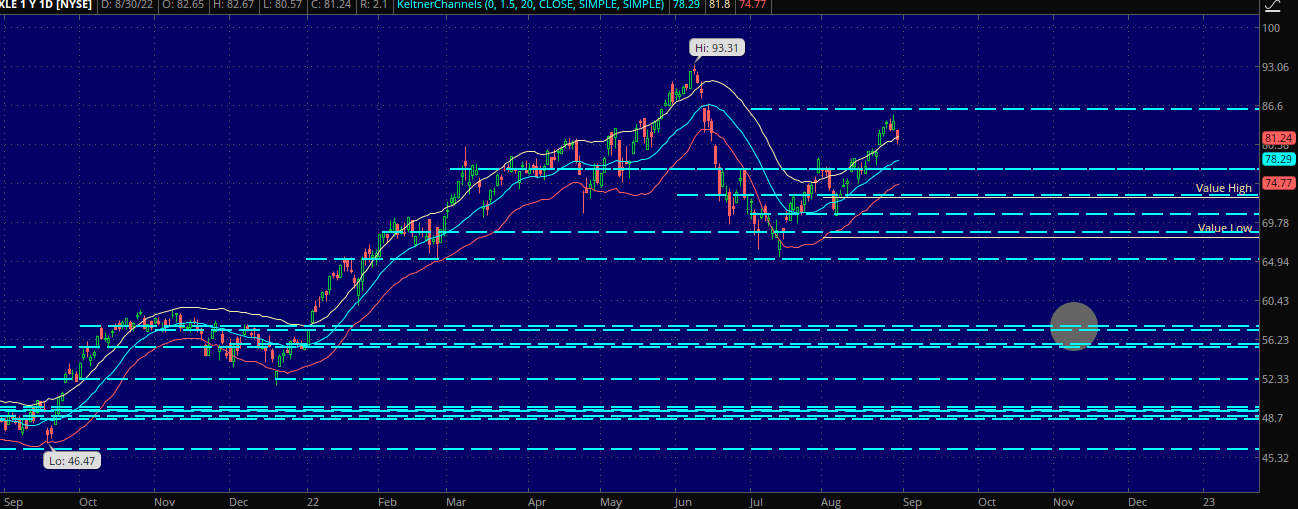
The chart above is a daily, one year chart of $XLE. After its initial thrust lower in June/July, $XLE saw a six week retracement, finding resistance at the June POC of 85.85. This appears to be a simple bear flag coming off the July low. As you can see $XLE peaked briefly above the top Keltner, and today began to selloff back underneath the top Keltner band. This is a great short entry, and caught my eye today.
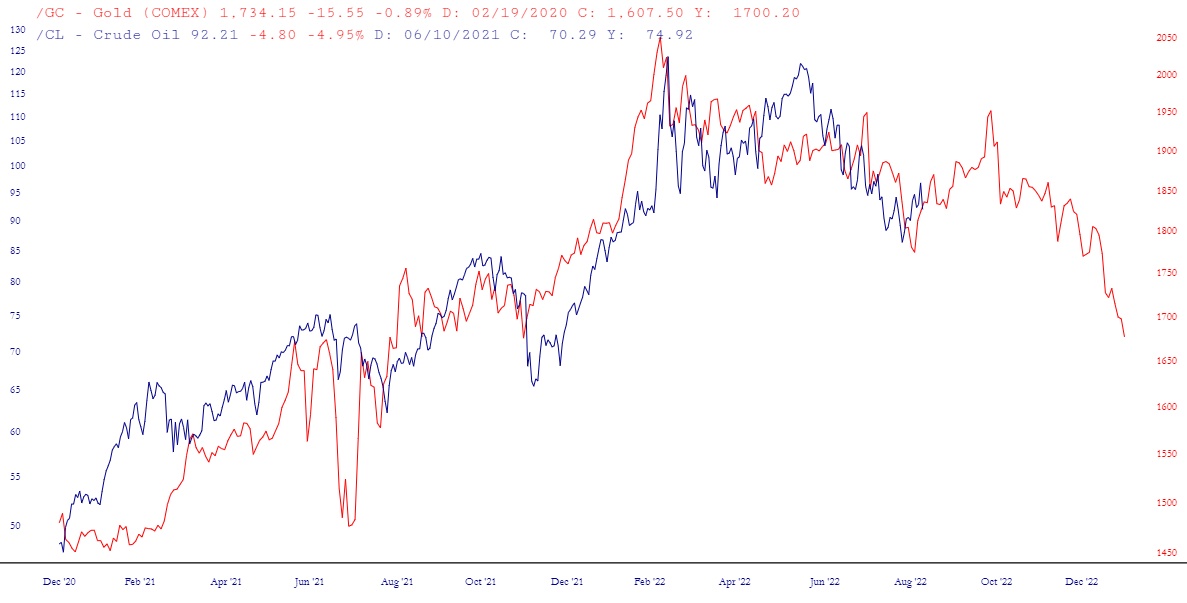
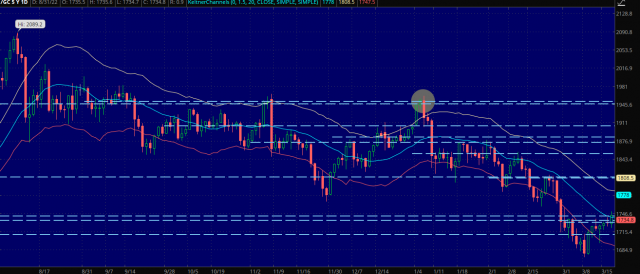
So why do I expect a 30% selloff in $XLE over the next few months? One of the tools I use to forecast how /CL might operate is to look back at how /GC acted twenty months prior. This gives us a good echo for what direction to expect in /CL now. The time period to look at for /GC is August 2020 through March 2021. I have circled where we are on the analog, and it is suggesting we should be expecting further weakness in /CL for the next two to three months.
Looking back at the $XLE chart, the June/July decline found support at the January POC of 65.15. I would expect this level to get taken out. If that occurs, there is a large air gap down to the next POC cluster which starts at 57.60. Happy hunting.
Bonus Chart from Tim – – I was intrigued, so I monkeyed around with layered charts and came up with the item below. Thank you, as always, TNRevolution!