
The first chart is the DJIA divided by the CPI Index (overall level, not annual change). A return to the 2000 level would be a roughly 50% inflation-adjusted decline.
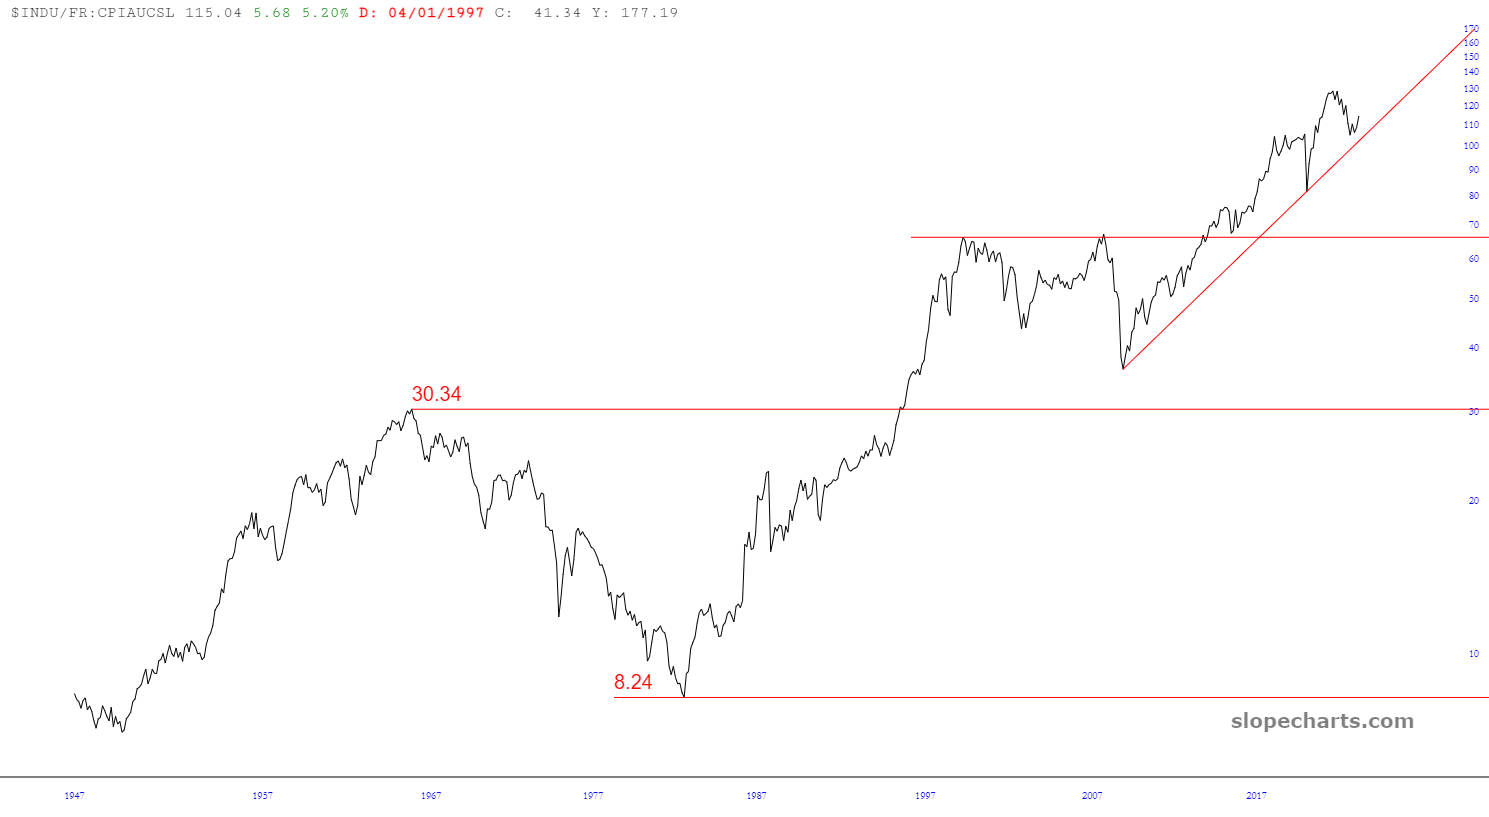
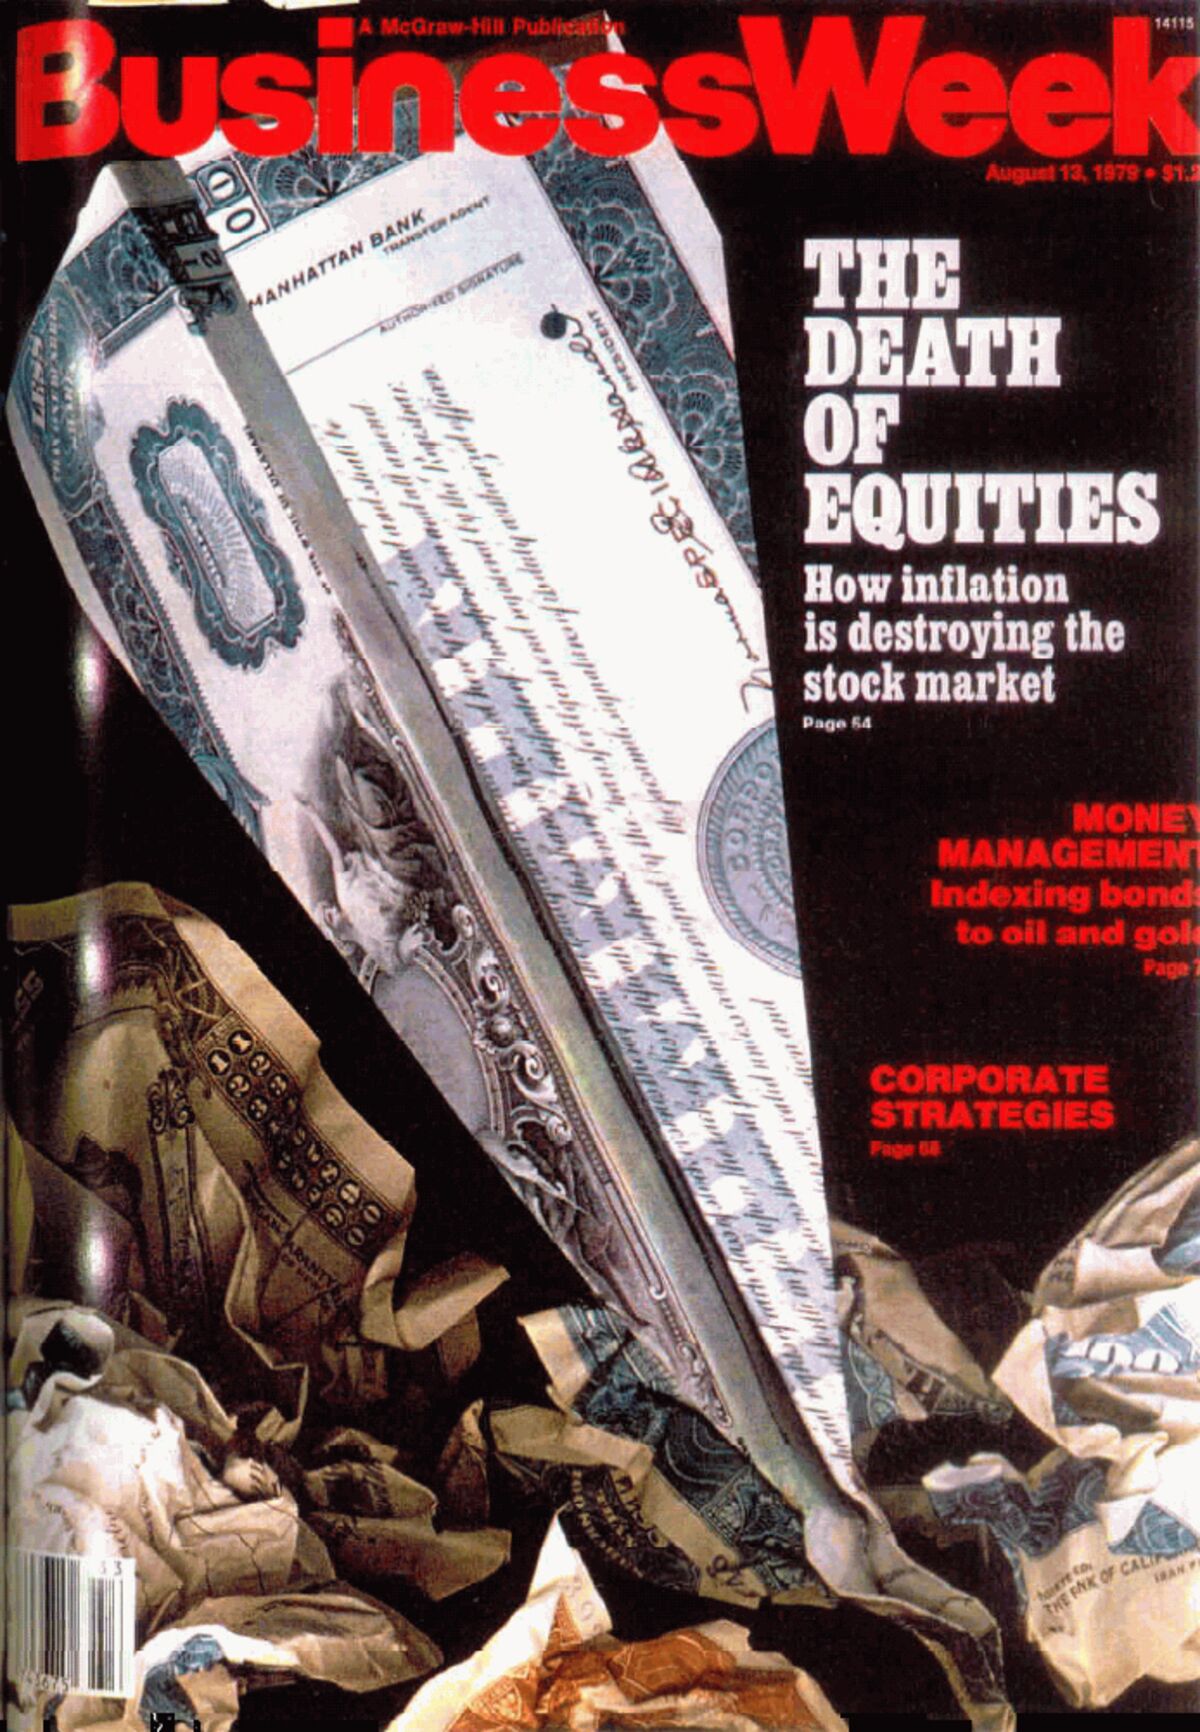
The 1970s inflation-adjusted decline was 73 percent, or 50 percent plus another 50 percent loss. It almost reversed all gains of the prior bull market. Helps to understand why the bear markets of 2000 and 2008 were bought, compared to 1982 when Business Week asked if equities were dead. If higher inflation persists, stocks are in deep trouble. It took 30 years to “break even” on the nominal index from 1966 to 1996.
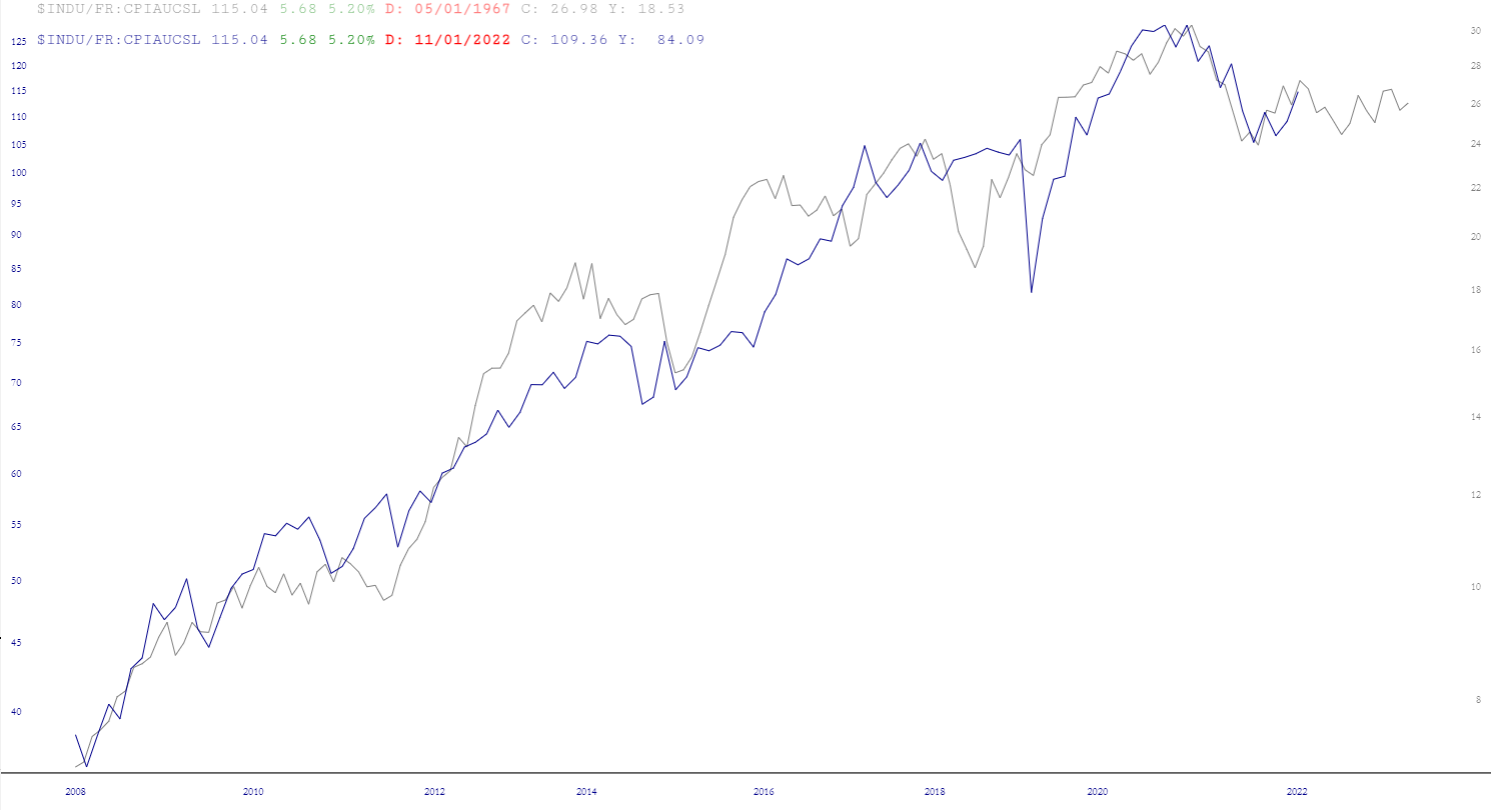
I thought the two pre-inflation bull markets looked similar, so I lined up 1949-1966 top and 2009-2021 top. The inflation-adjusted gains were about 330% into 1966 and 250% into 2021.
