
Well, the market may or may not turn here, and it may or may not continue onward. All my previous analyses seemed to have broken with the current broad market action. So rather than speculating on which direction the broad market may go, I’ll throw out some individual stock ideas, some long, some short.
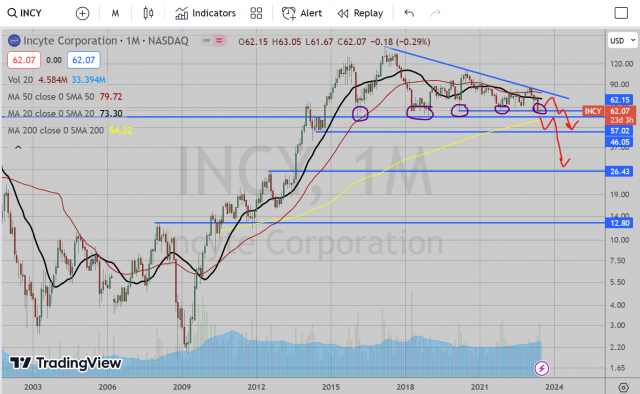
On the monthly chart, I am seeing clearly lower highs since the peak in March 2017. The peaks also make for a nice trendline as well with a perfect rejection at $86 in January of this year. We are at a major support zone down here at 62 which it has managed to stay above since early 2016.
There are several things I like about this short idea. 1) This stock clearly is not correlating with broad market movements. 2) Each time it has tested this area is has bounced and escaped rather quickly, but each bounce yielded diminishing returns and with less “oomph”. So that tells me that while bidders still exist, a breakdown of this area would be potentially epic as all those investors (institutional or otherwise) who’ve been holding and have less and less to show for it. 3) Lastly, this is a biopharma company, which usually pack the most punch when they trade like penny stocks and they get their first big FDA approval, etc. This doesn’t have “AI” and is not any part of the “tech” mania trade which has been going on for months now. As such, it’s just not what’s sexy right now, making it ripe for a short.
The true low price of this massive topping pattern is about $57, but I think there is some short-term trading profits to be made here as well. Either we break down almost immediately from here (this is a monthly chart, so “immediately” could mean additional consolidation for weeks), or a short term drop towards $57 with a bounce back towards the trendline by September, where one could get short again with better risk:reward.
Potential target areas for this short trade are $45 (prior support from 2014 consolidation), $26 (prior resistance/breakout area from August 2013), and finally $12.50 (breakout from bottoming pattern from 2009-2010).
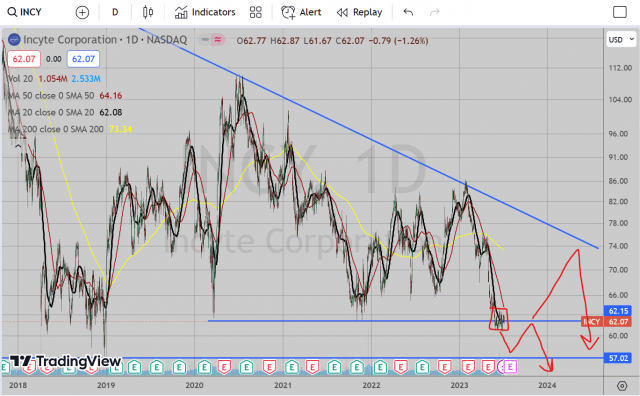
Looking at the daily chart, I am watching this little consolidation on the daily chart very closely. As opposed to previous trips down here, there is definite resistance holding this down now. I can’t be sure what news is there that investors should be aware of, but someone knows and that someone (or several someone’s?) is/are definitely unloading with sell orders at $63. Potential paths as explained above on how I think this can play out. So at minimum, I think this is worth a short-term short here with stop above, let’s say, $63.50, and a target of $57 to begin with. With a short entry price of $62, that is a risk:reward of 1.5:5, or 3:10 using round numbers. Lay your trades out accordingly on this one, set appropriate stops.
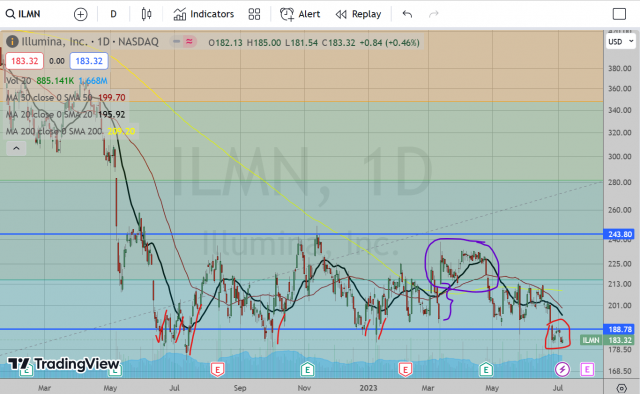
I won’t go into too much rehashing as I posted about this back in February or March. Leading up to March, this was looking like a fantastic short, ending March 10th with 3 large red candlesticks to test the lower end of this range around 190. Then good ol’ activist investor Icahn had to open his mouth and say…something. Who knows, who cares. (I personally think activist investors have too much sway over public investors sentiment. Seriously, if Warren Buffet tomorrow says he likes to wrap his turds in boxes from “The Container Store”, I have no doubt that investors would send that stock flying).
Anyways, getting away from my point. The point is, that gap up sent this stock up, taking out some stops along the way, but ultimately still staying within the range I previously mentioned for this stock (so sellers still unloading up between 240-250). Now what is really interesting to me is how it has been bouncing along this support zone for over a year now. I also marked with little red lines to show how each time this dipped beneath 190 investors saw this as a “buy the dip” opportunity.
And this time is different. The sellers are now holding resistance at 190 for the past week. Go ahead and take a look on the weekly and monthly charts (weekly chart shows this just closed its first red candle below this area since the breakout in July 2017). I had a previous target in my last post for about 120, which I think we should get there by August-September. My possible further target is $80 or lower, however, as this stock, much like INCY, is just not in a sexy industry right now. I’d set a stop at 190 with that first target of 120 and hold on for a few months. If this bounces back up, let your stop work and look for better entry at top end of this range.
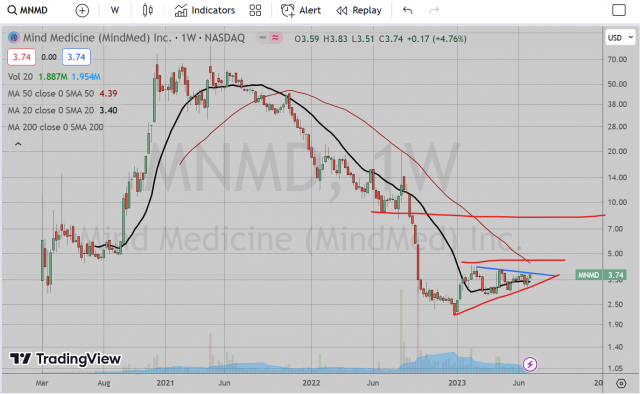
This company is a clinical stage biopharma company which has a few products under its belt, but really it’s claim to fame is that it is focusing efforts on finding medicinal purposes for the chemical compounds of psychedelic mushrooms. Now, I don’t know the ins and outs of how this may be impacted by this such as legalization or even decriminalization, but all I know is the chart seems to want to point up. This actually shook me out a few weeks ago, but I am ready to get long again.
The short-term obstacles I see are the 50 week Moving Average, which this seemed to adhere to the tick back in August 2022 before rejecting very (VERY) harshly and the prior support/big round number zone of around $5. However, this bottoming pattern is showing higher lows, so someone is accumulating down here. If this can follow through then this has a chance to push through $5 and hit at least $8 I would think. The closest stop would have to be beneath 3.15 or so, which is a long ways away (almost 25% drop), so size accordingly. Also, if you want to take a bigger gamble, you can look at CYBN, which SOLELY focuses on psychedelic chemical usage for mental health. It’s a penny stock, so very risky, but just had 2 weeks of a pop, so some people are accumulating.
I’ll see what else I can scrape together, but for now, individual stocks are the only things I will focus on as the broad markets feel too wacky for me right now.
