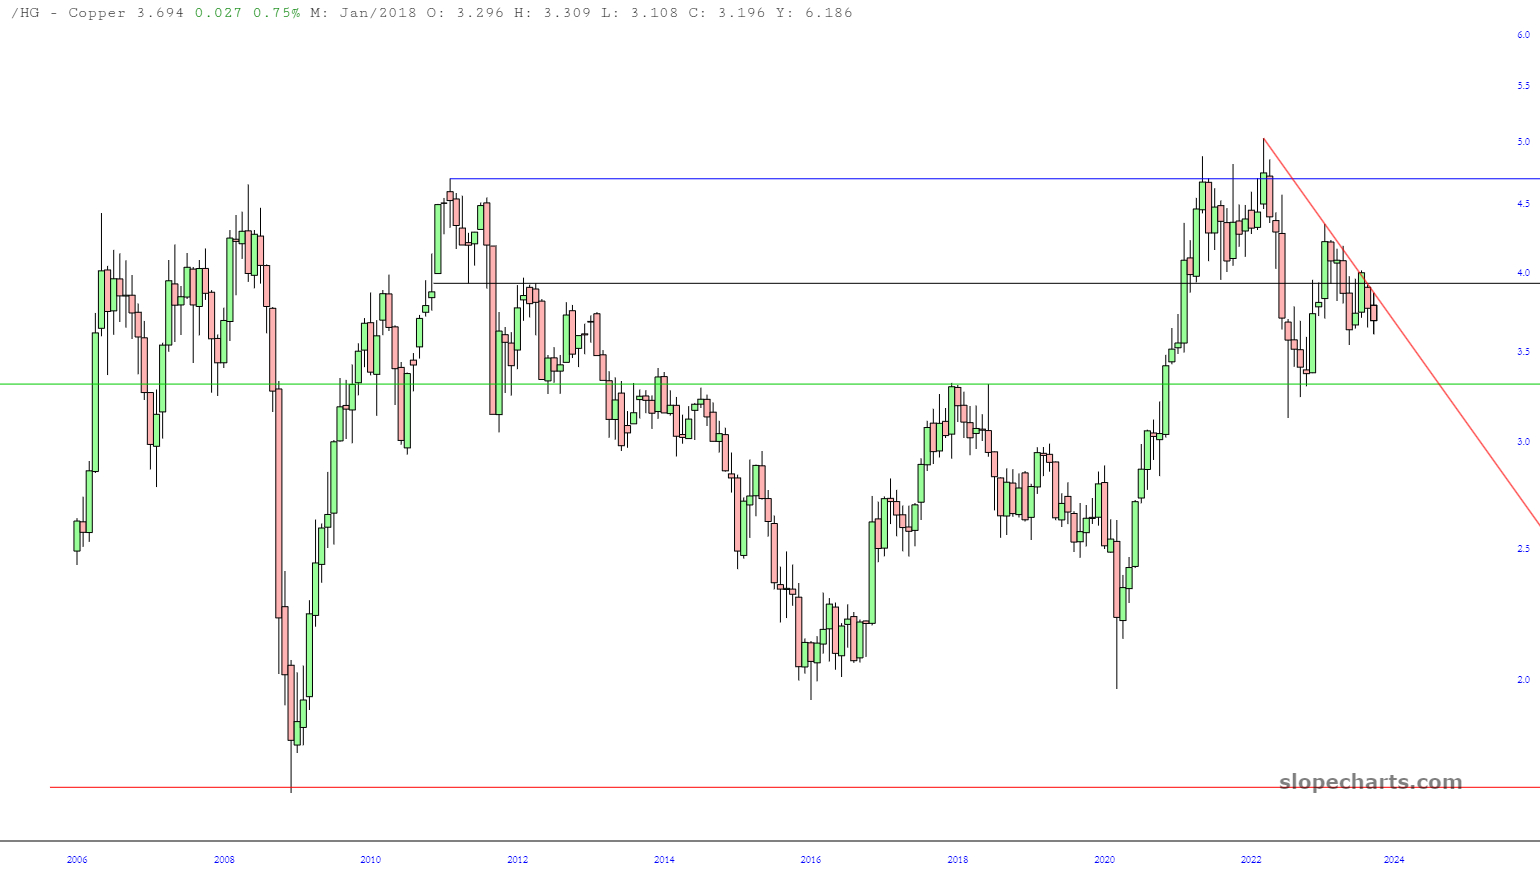
Assuming stagflation isn’t going to rip along with crude oil………copper looks like a rollover to $3.25 is in the cards. It won’t take much weakness to test that level.
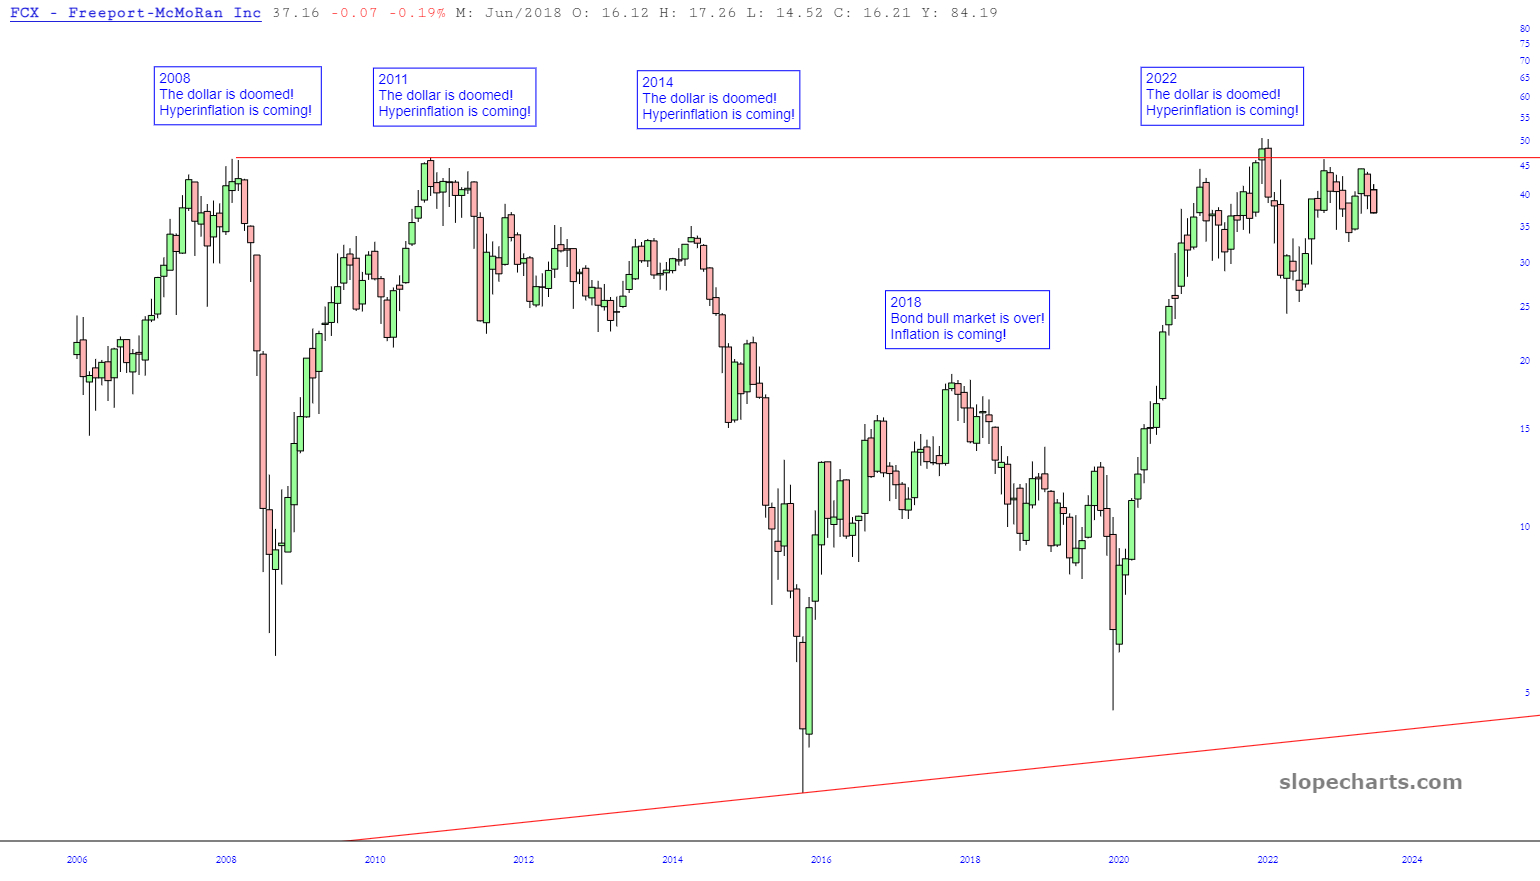
Here is FCX looking toppy:
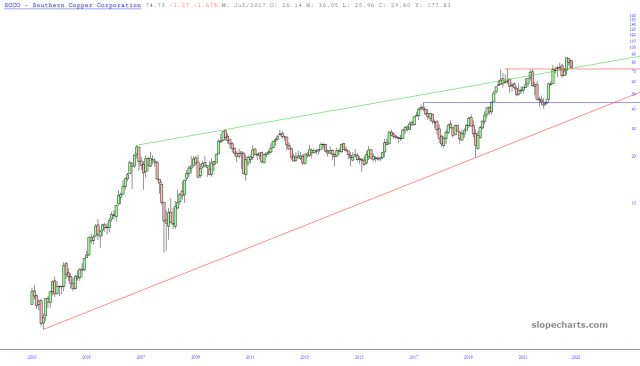
SCCO went much higher and is coming down to a former resistance line.
Both look like good short trades here, but wait, there’s more. Let’s look at these stocks layered with the price of copper.
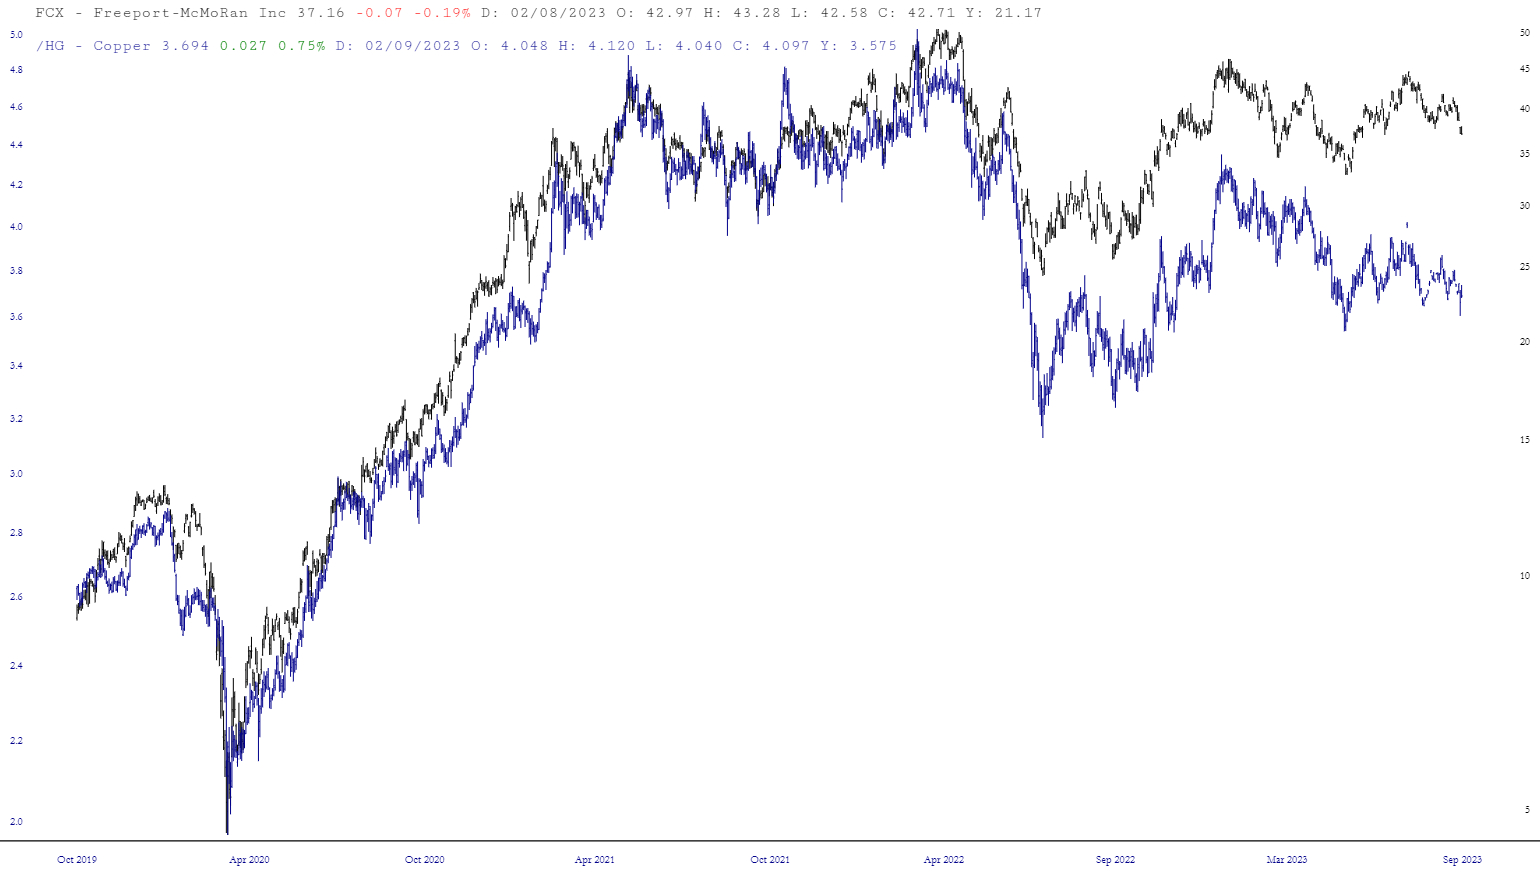
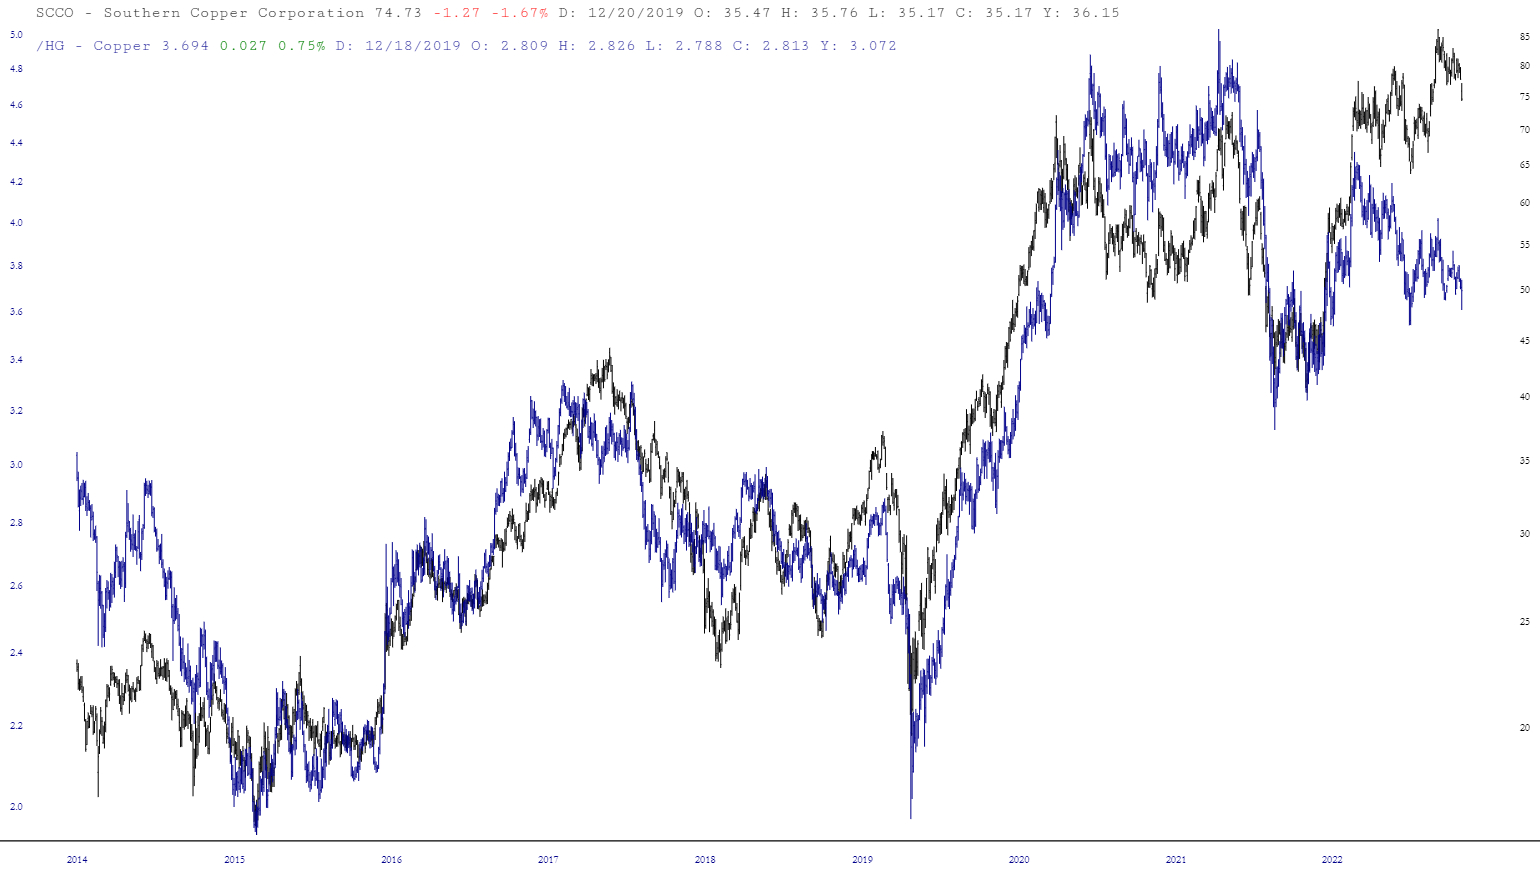
You can do this yourself on Slope and while there are other spreads like this, they’re rare. If you zoom in close, the spreads disappear because the stocks closely track the price of copper in the short-term. This is good news since it raises the probability that deviations are meaningful, but the question is, does this spread have anything behind it?
I think so. The other time a big spread opens up is into July 2014.
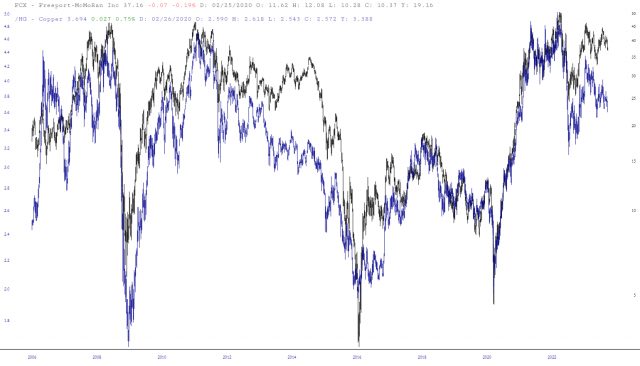
The U.S. dollar bull market started at the end of June 2014. The Fed was ending QE. Commodities would sink with crude falling spectacularly in November of that year. There were signs of recession in China’s northeast back then. China later had to let the yuan drop in August 2015. It took global coordinated central bank action in February 2016 for a rebound. Meanwhile, back in summer 2014 people thought the economy might finally exit the post-2008 depression (it hasn’t yet), expected more Chinese demand and commodities investors were oblivious to what was coming.
My read is commodities investors are nearly as excited now, but there’s a huge flaw in their growth assumptions and copper is pointing this out. If there’s a deflationary recession first, inflation will benefit gold and silver, not industrial metals. The dollar is at a spot where if it pops, it’s going to start running to new 52-week highs vs the yuan, and break into zones where it ran hard against the yen and won.
What else can FCX and copper tell us? Check out the ratio of FCX to copper:
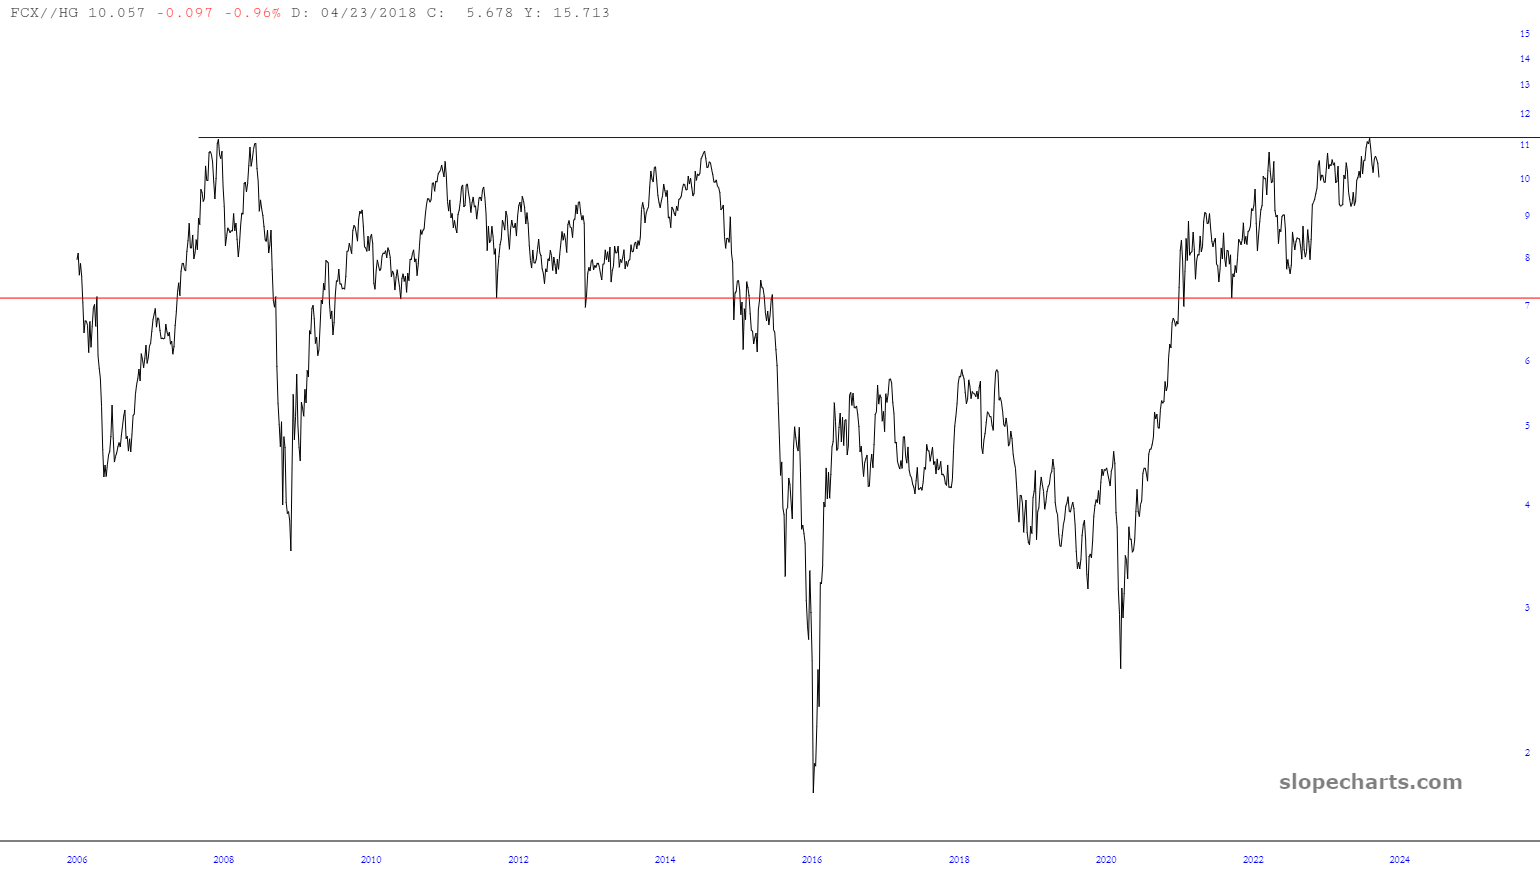
FCX trades with HG, but when the ratio peaks along with copper, that’s a good indicator of a turn. Some of the peaks are December 2007, June 2008, January 2011, July 2014, and August 2023. The current peak went a smidge above the December 2007 peak.
Now for the final piece. This ratio, along with crude oil.
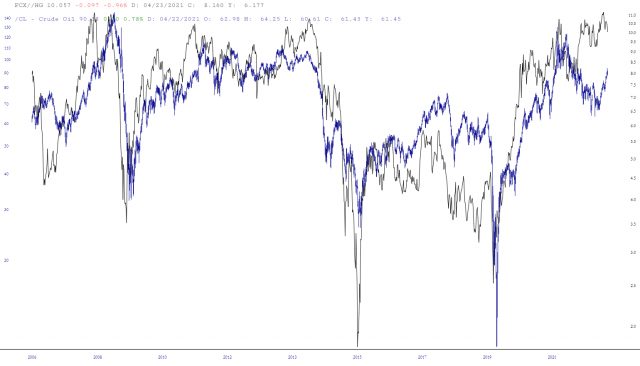
This is not as good of a spread signal, but peaks in FCX/HG have also lined up with peaks in crude. Copper alone is similarly correlated with oil, but it peaked in 2011 and was way down by the time crude rolled over in 2014. Whereas FCX/HG was back near a peak, better reflecting stock market (and crude oil) sentiment and the short opportunity.
Overall, all these signals are pointing bearish, but what piques my interest is the gap with FCX and SCCO looking very extended compared with copper. They have about a 30-percent downside if they catch-down to where copper is now. If copper drops further, much more is possible on the downside. An actual recession or deflationary turn of events will generate further losses on the downside.
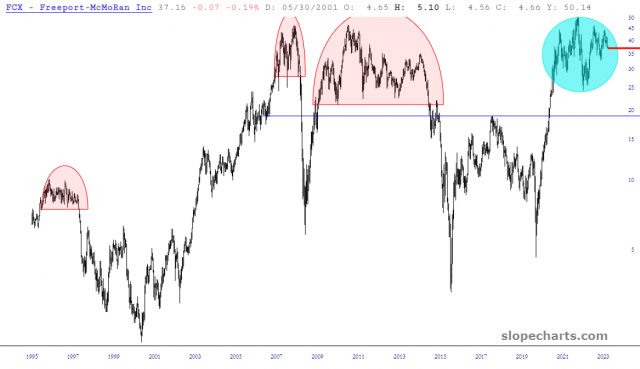
BONUS CHART FROM TIM:
Thanks, LZ, for this great post. I was intrigued when I fired up FCX and spotted what could be a diamond top: