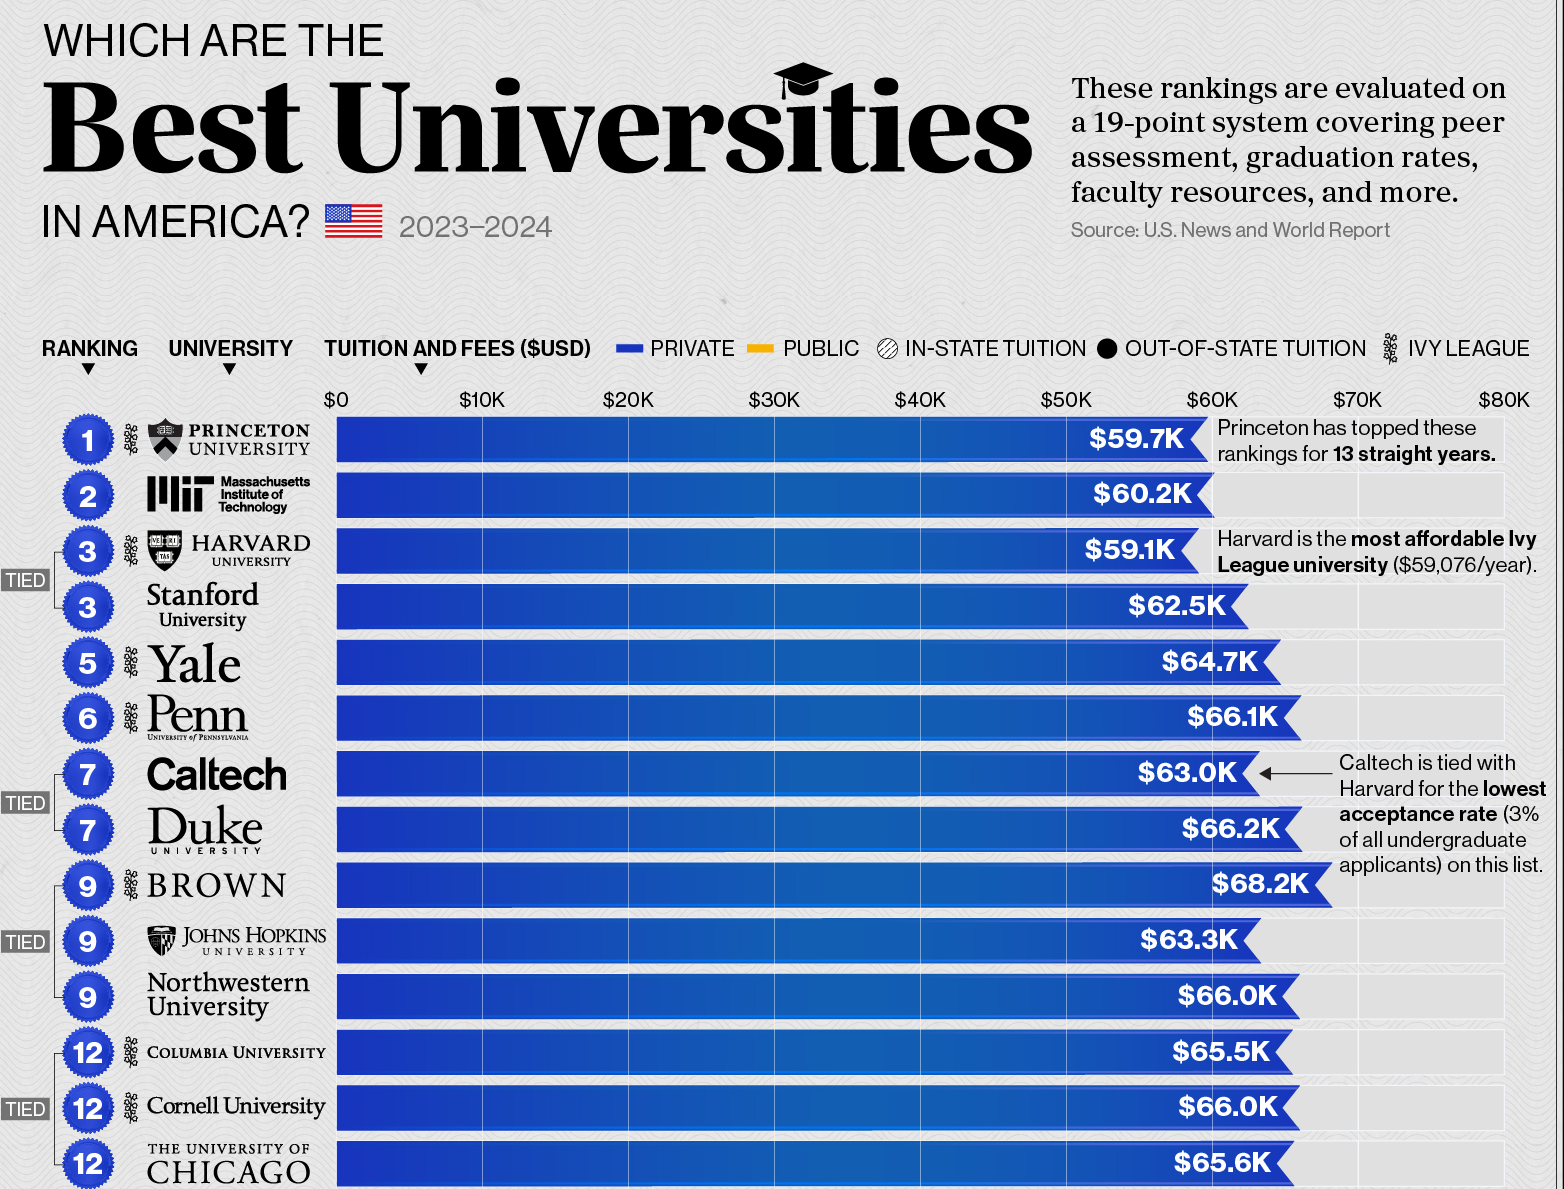
I took the first chunk of this ranking (which are all private schools, by the way). I’ve got to protest the tuition claimed, because I’m shelling out $90,000 a year! Anyway……..
Slope initially began as a blog, so this is where most of the website’s content resides. Here we have tens of thousands of posts dating back over a decade. These are listed in reverse chronological order. Click on any category icon below to see posts tagged with that particular subject, or click on a word in the category cloud on the right side of the screen for more specific choices.
I took the first chunk of this ranking (which are all private schools, by the way). I’ve got to protest the tuition claimed, because I’m shelling out $90,000 a year! Anyway……..
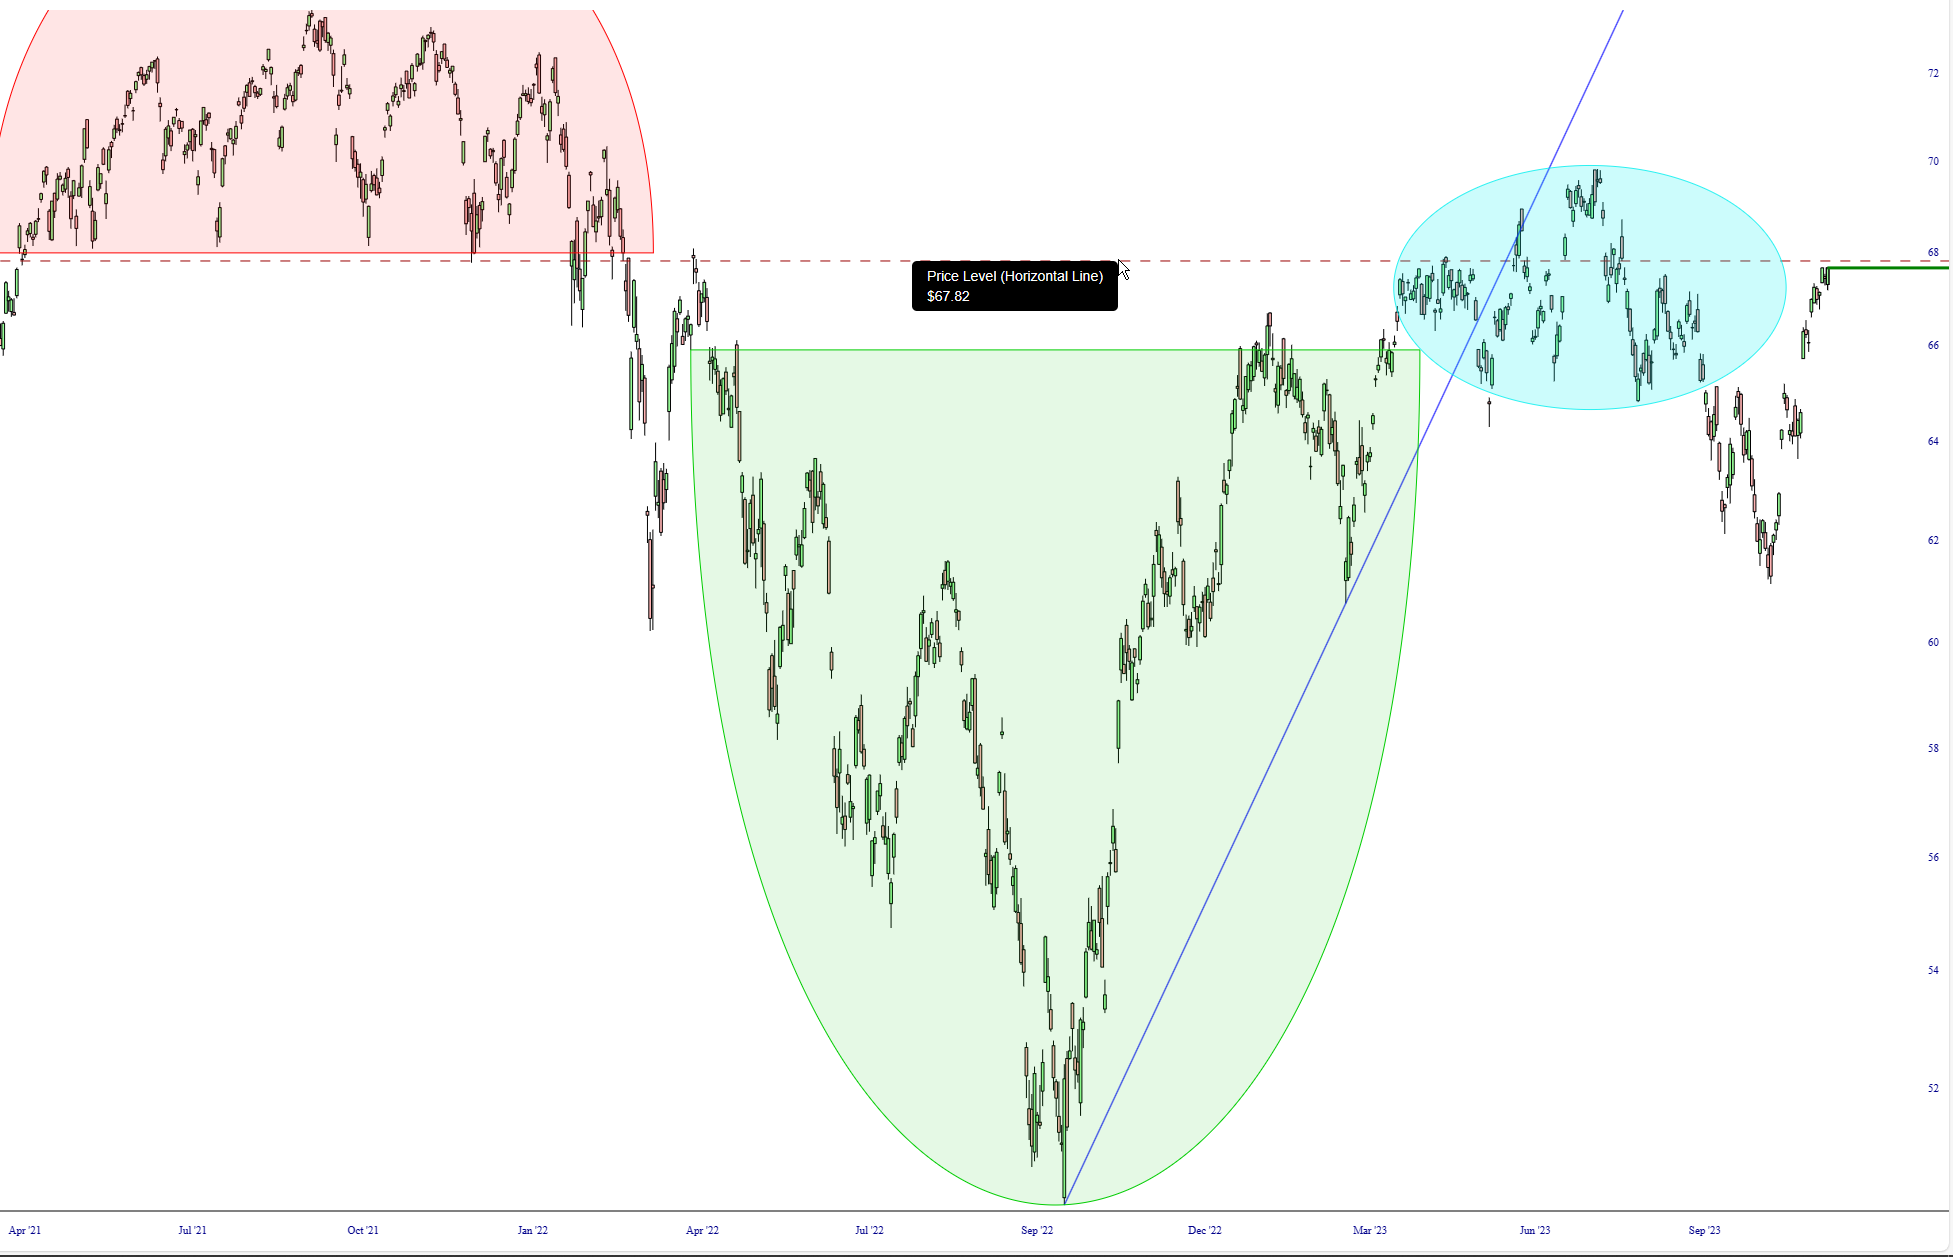
Below is a chart over the past couple of years of IEFA, the worldwide equity fund (without including North America). Take note of that dashed line, which is at the price level 67.82. I would propose that, if we can stay below this price gap, this fund remains quite vulnerable to a renewed sell-off, since this is an important pivot point in the context of all this price action.
Not that long ago, I never, and I mean never, bothered using the sinewave tool on any chart. These days, I’m becoming increasingly intrigued by the financial instruments which seem to conform to some kind of steady rhythm, and it turns out that my favorite ETF, the utility symbol XLU, has an intriguing relationship with this as well.

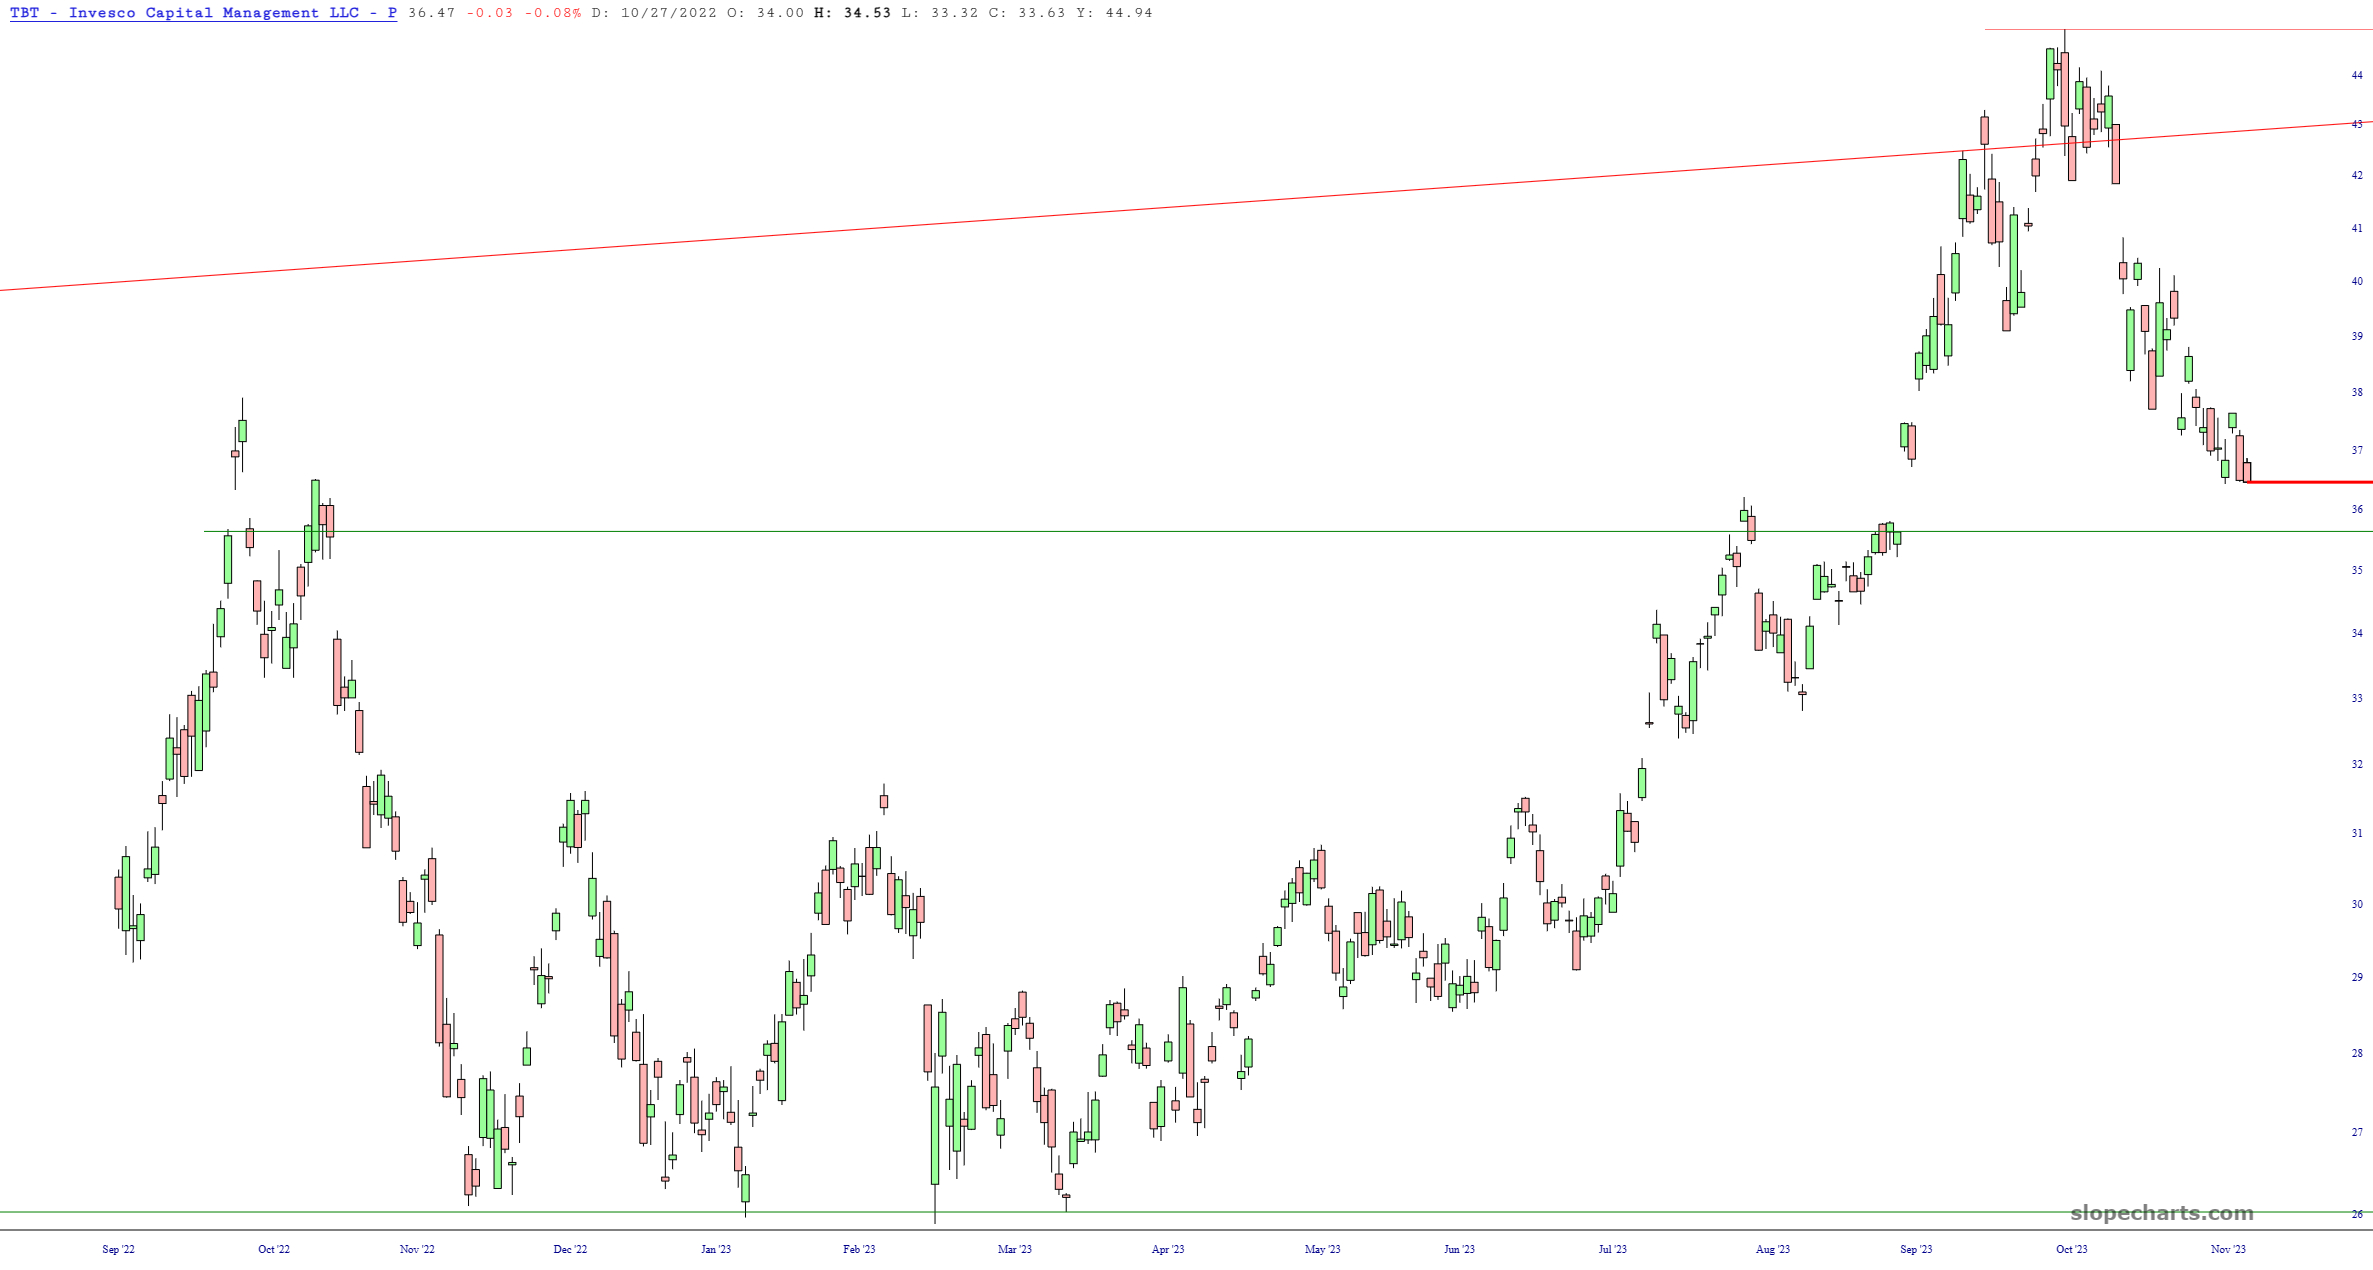
Plunging interest rates (and Yellen’s little scheme from mid-March) have been the gasoline powering this rally. It is therefore important to watch for any kind of inflection point. The TBT (ultra-short fund based on bonds) is getting close to a crucial price gap, which in my estimation could be such a pivot point.
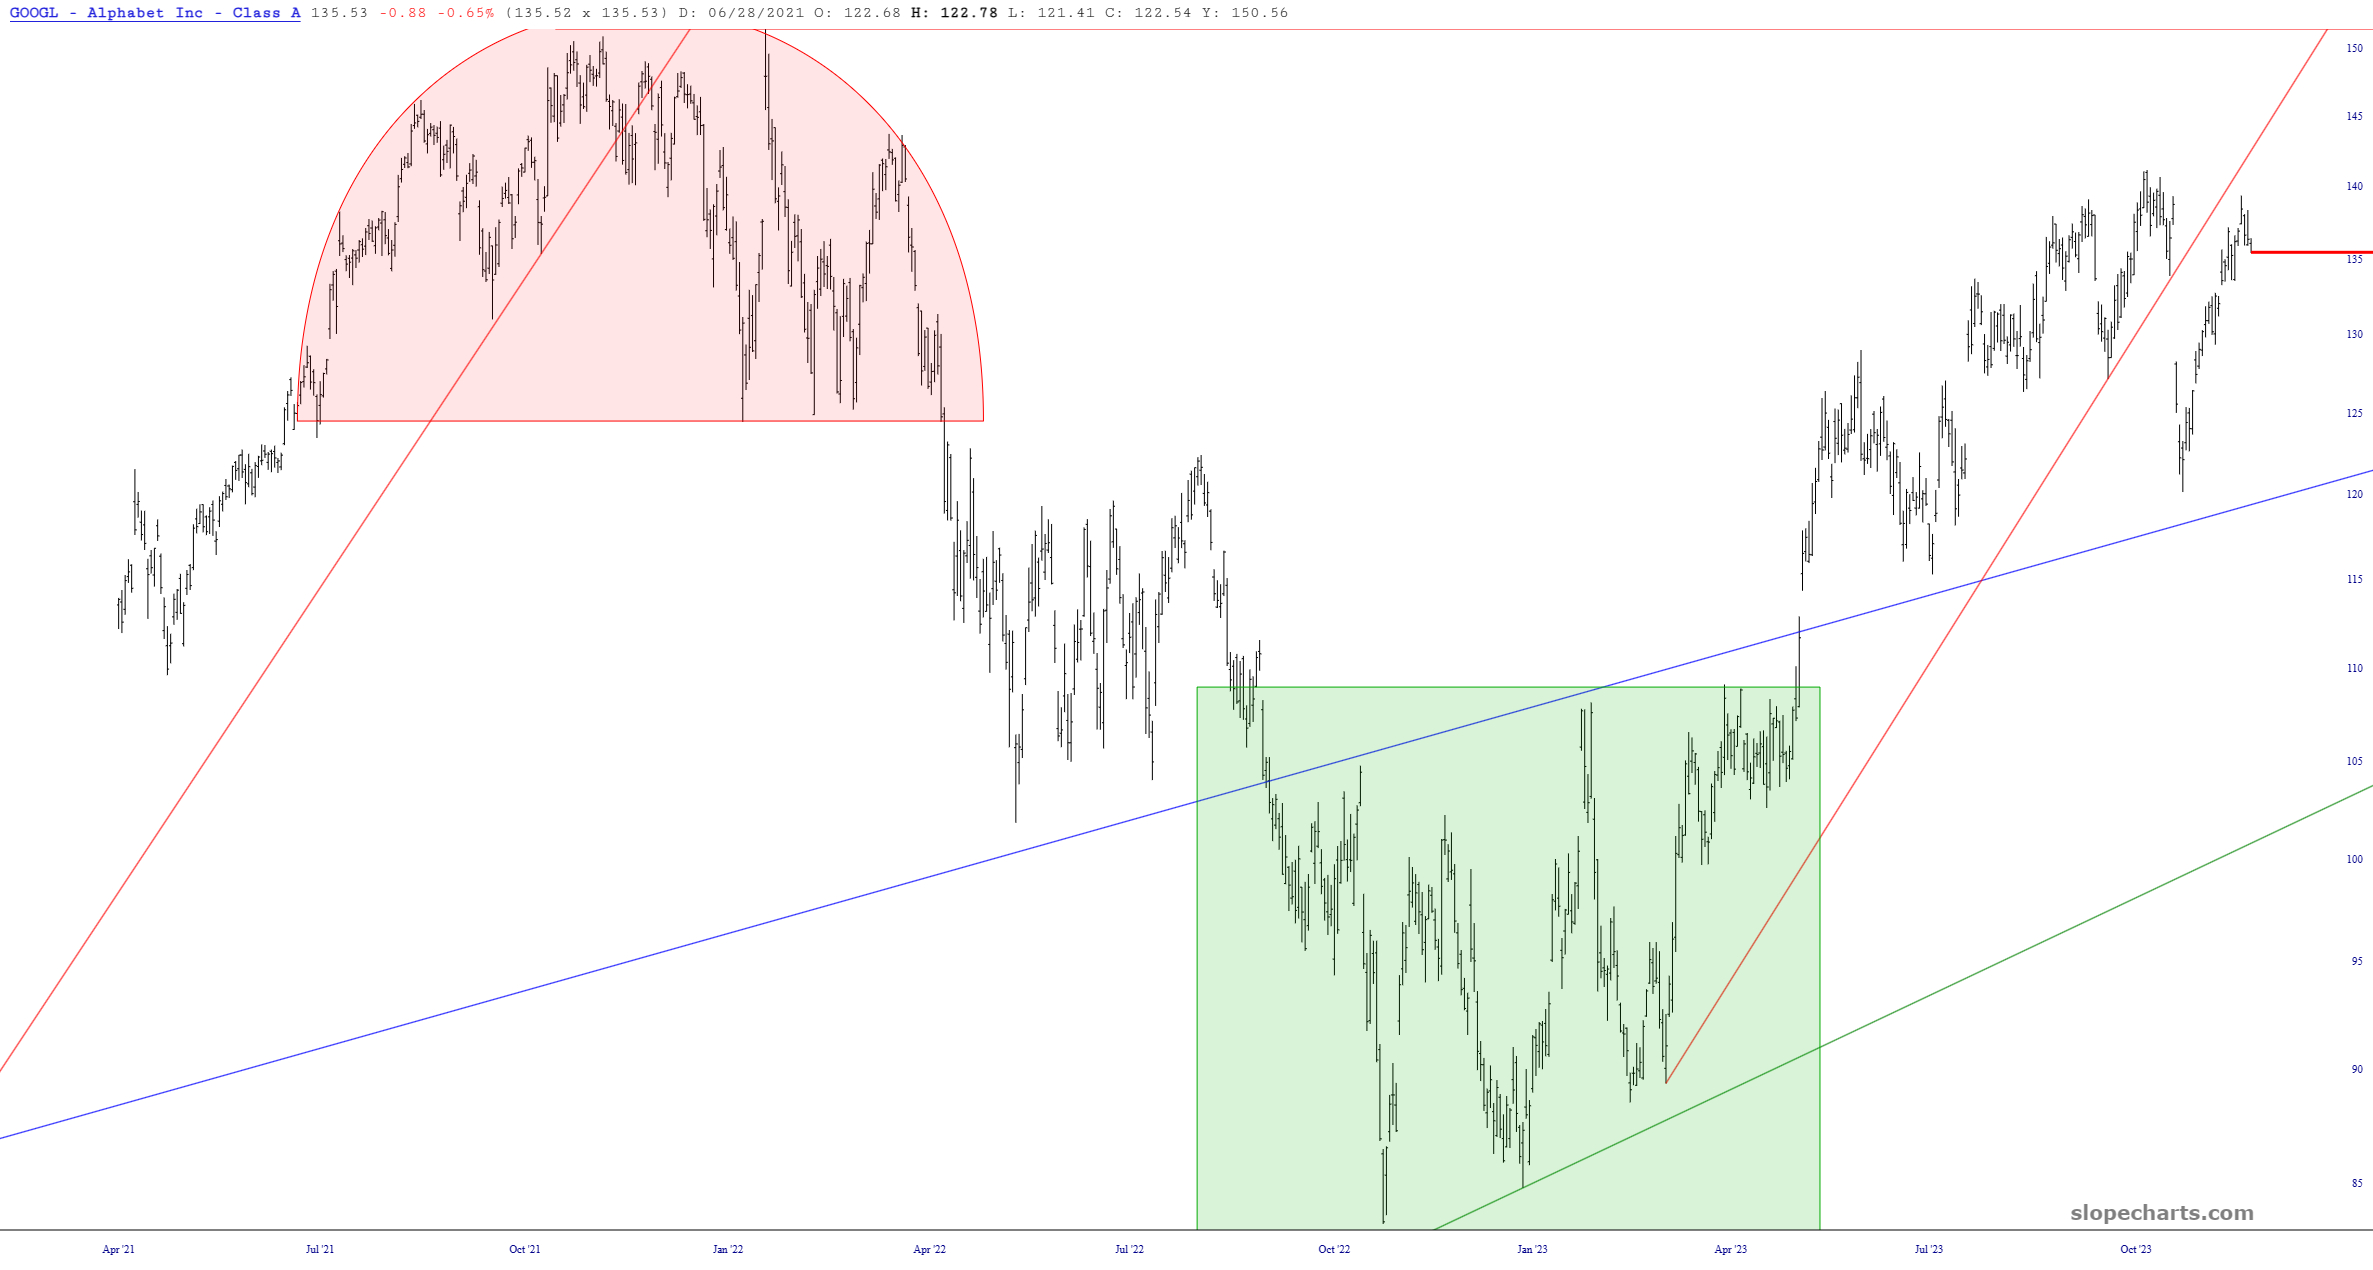
Below is a chart of Alphabet (symbol GOOGL) which has a rather interesting analog with what it was doing two years ago. Both now, and then, the stock had broken a trendline (drawn in each case in red, and which are roughly parallel with one another) and had bounced to the underside, only to be followed by a lot more weakness. GOOGL is, as you know, one of the Mag-7 stocks, and if this weakens, it will poison the entire equity market.