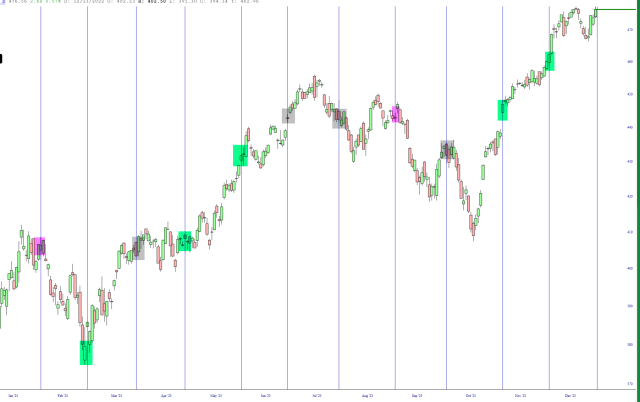
Here is a chart I put together of the SPY with a vertical line denoting each monthly CPI report. This is all thanks to our spiffy Event Markers feature! The green tint indicates reports that led to a generally bullish month, the magenta for bearish, and grey for neither. As you can see, the last two reports simply egged on the bulls. Let’s see what Thursday morning holds, with the market presently at lifetime highs.


