Examining the chart of the S&P 500 futures [/ES], note the bearish rising wedge formed from the October 2023 low (purple). Then note the smaller, short-term wedge emanating from the May 31, 2024 low (also purple, inside the aforementioned larger wedge).
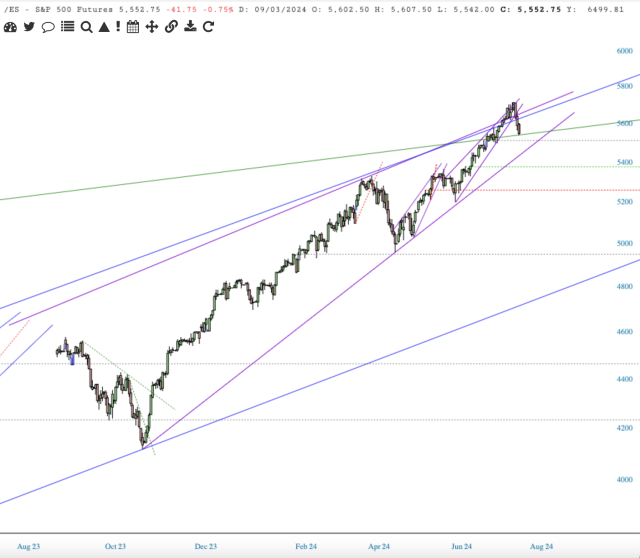
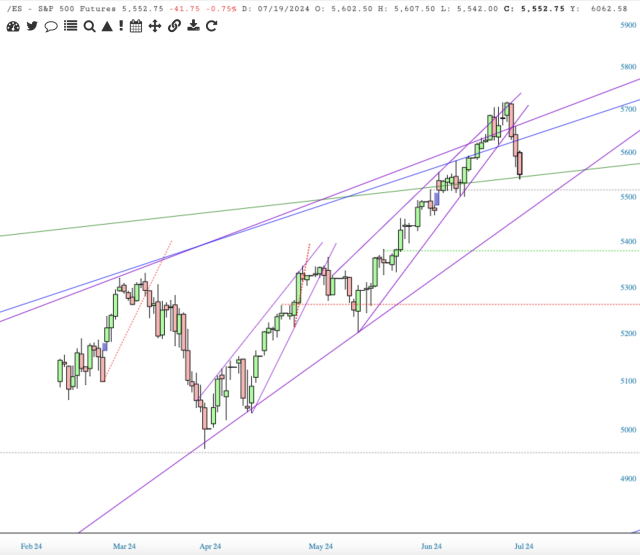
Both wedges lost support last Wednesday. That breach of support was followed by two more days of selling, all of which culminated in the Three Black Crows candlestick pattern on Friday’s close.
Here’s what renowned candlestick aficionado, Thomas Bulkowski, says about three black crows pattern:
“Price trends upward leading to the start of the candlestick pattern then three tall black candles appear. Candles 2 and 3 of the pattern should open within the body of the prior candle, and all three should close near their lows, making new lows along the way.”
Check, check, check, and check: Friday’s /ES close met these criteria. Now, what?
The only right answer to what comes next is, who knows, but I’ll speculate with a guess anyhow.
Before more downside, it’s quite possible we get a bit of a bounce, guessing as high as 5620ish.
For the three black crows pattern to play bearish, price must fall below Friday’s low. For the pattern to end bullish, price must close above Wednesday’s high.
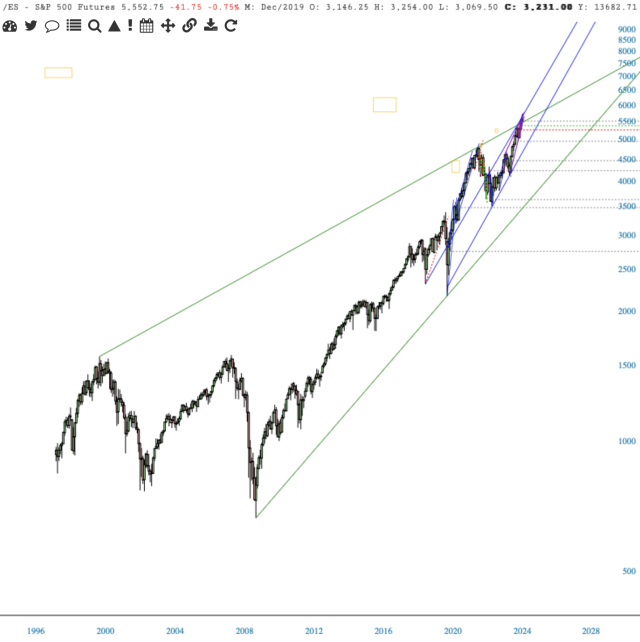
Long term perspective with the monthly chart.