

I was mentioning on Monday that the declines on DAX & Nikkei this week looked very interesting and I’ll show you why that was after I go through the short term setup on US equity indices.
I’m looking at those on the 5min charts today as the pattern setups are clearest there, and there is a strong common theme of bear flags forming on those charts.
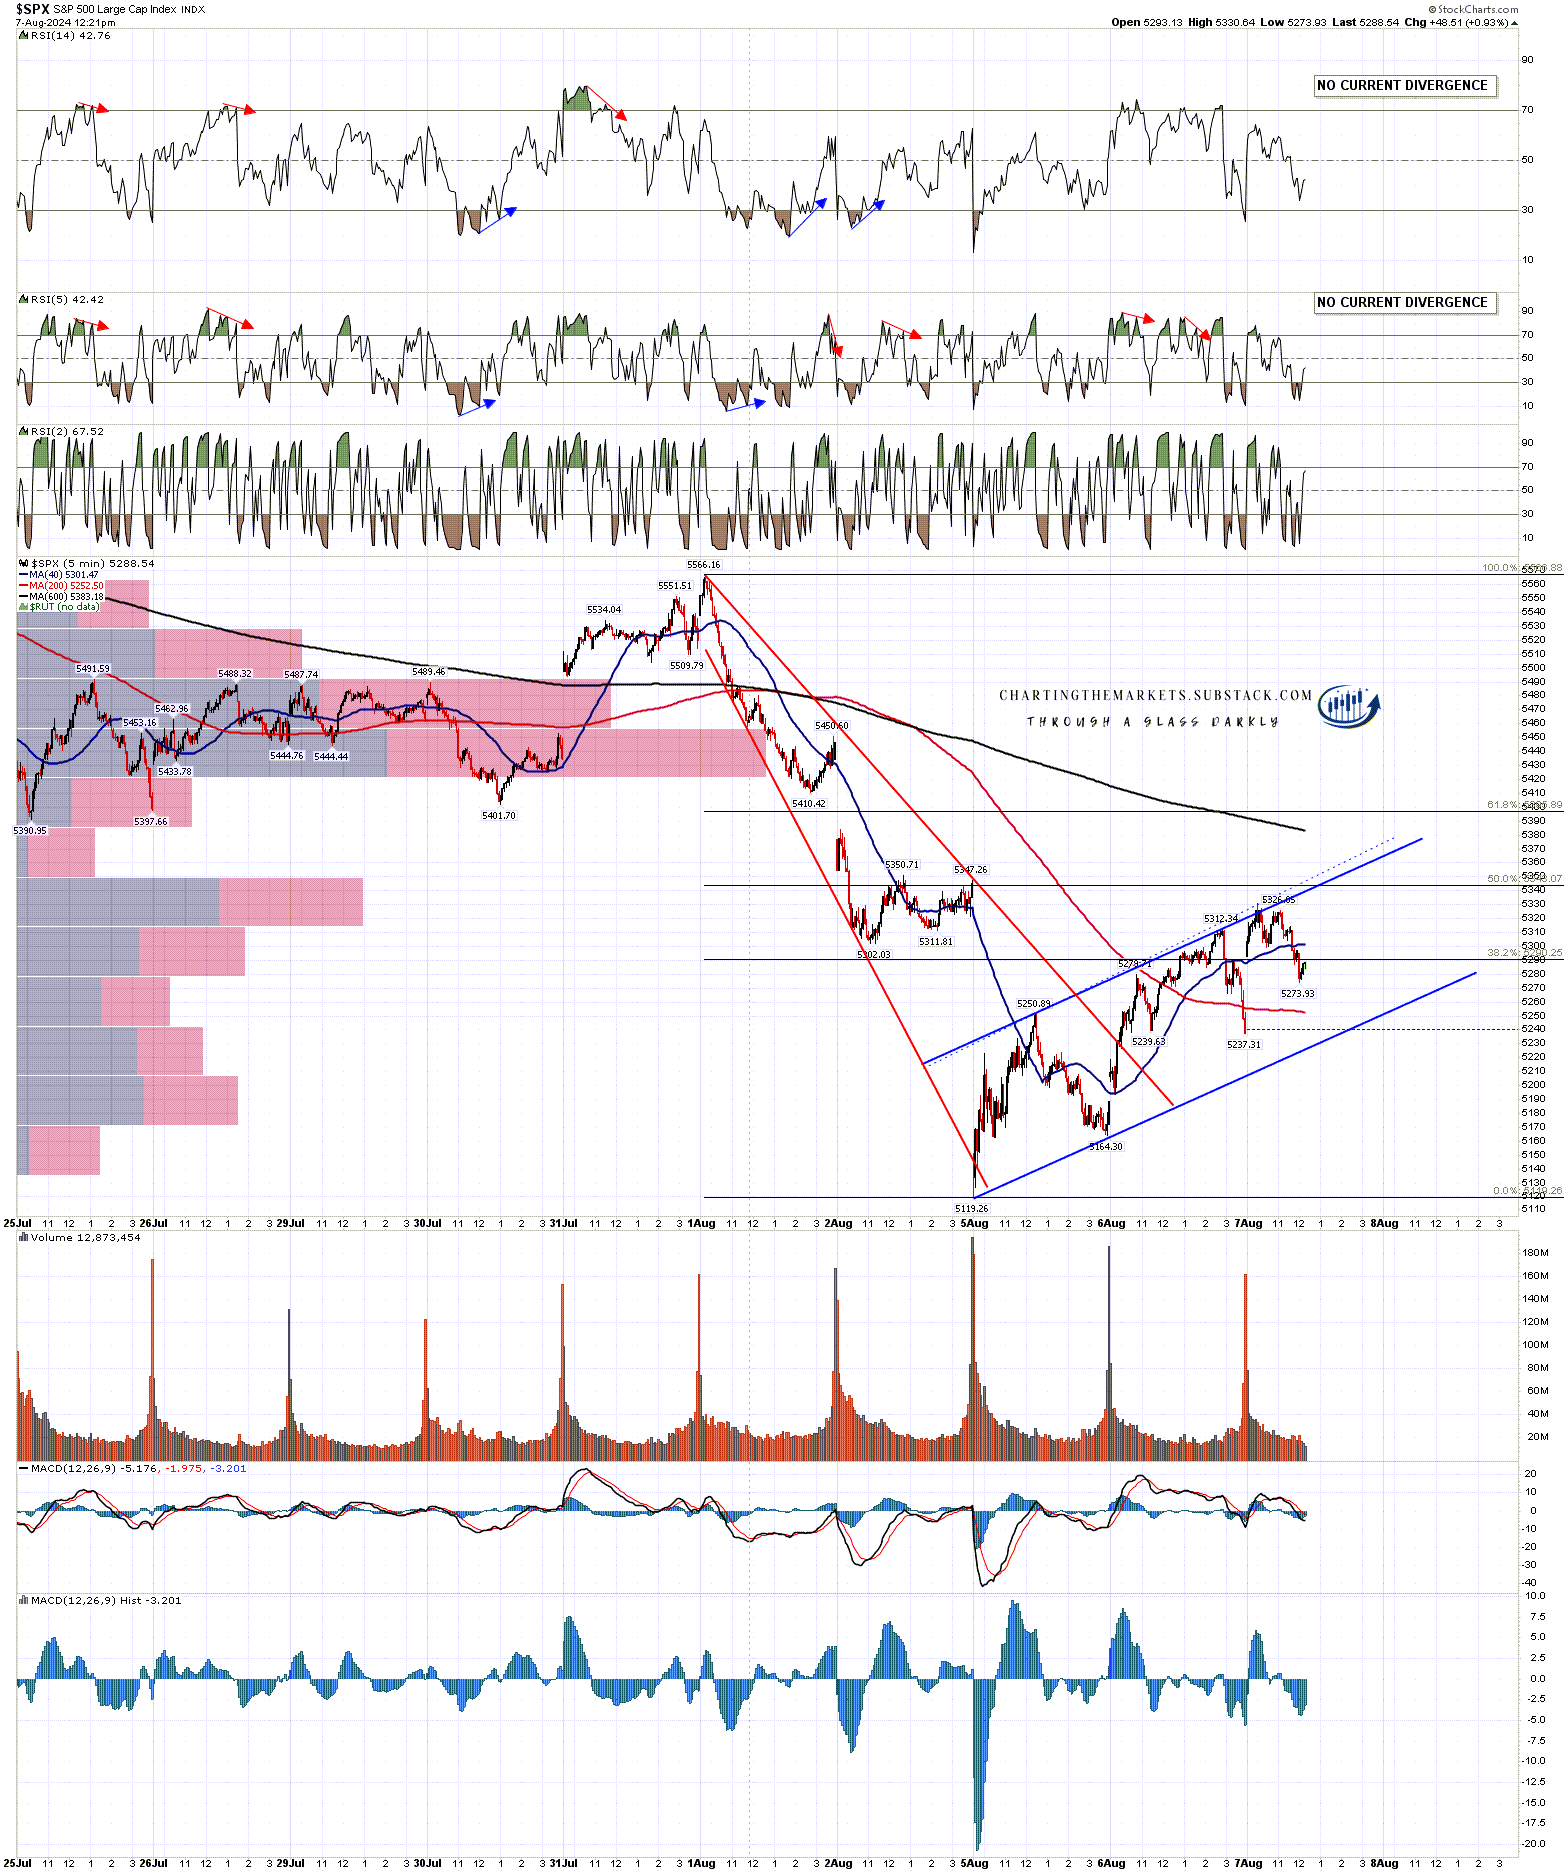
First on SPX where the rally from Monday’s low has retraced a little under 50% of the decline, there is no obvious reversal pattern to take SPX higher, and the move so far looks very much like a bear flag is forming.
Now there is a caveat here, in that about 30% of bear flags break up and, in those cases, that flag breaking against expectation can be the reversal pattern that takes the index higher but, that said, this is a pattern setup strongly suggesting that at least a strong attempt at a low retest is coming.
SPX 5min chart:
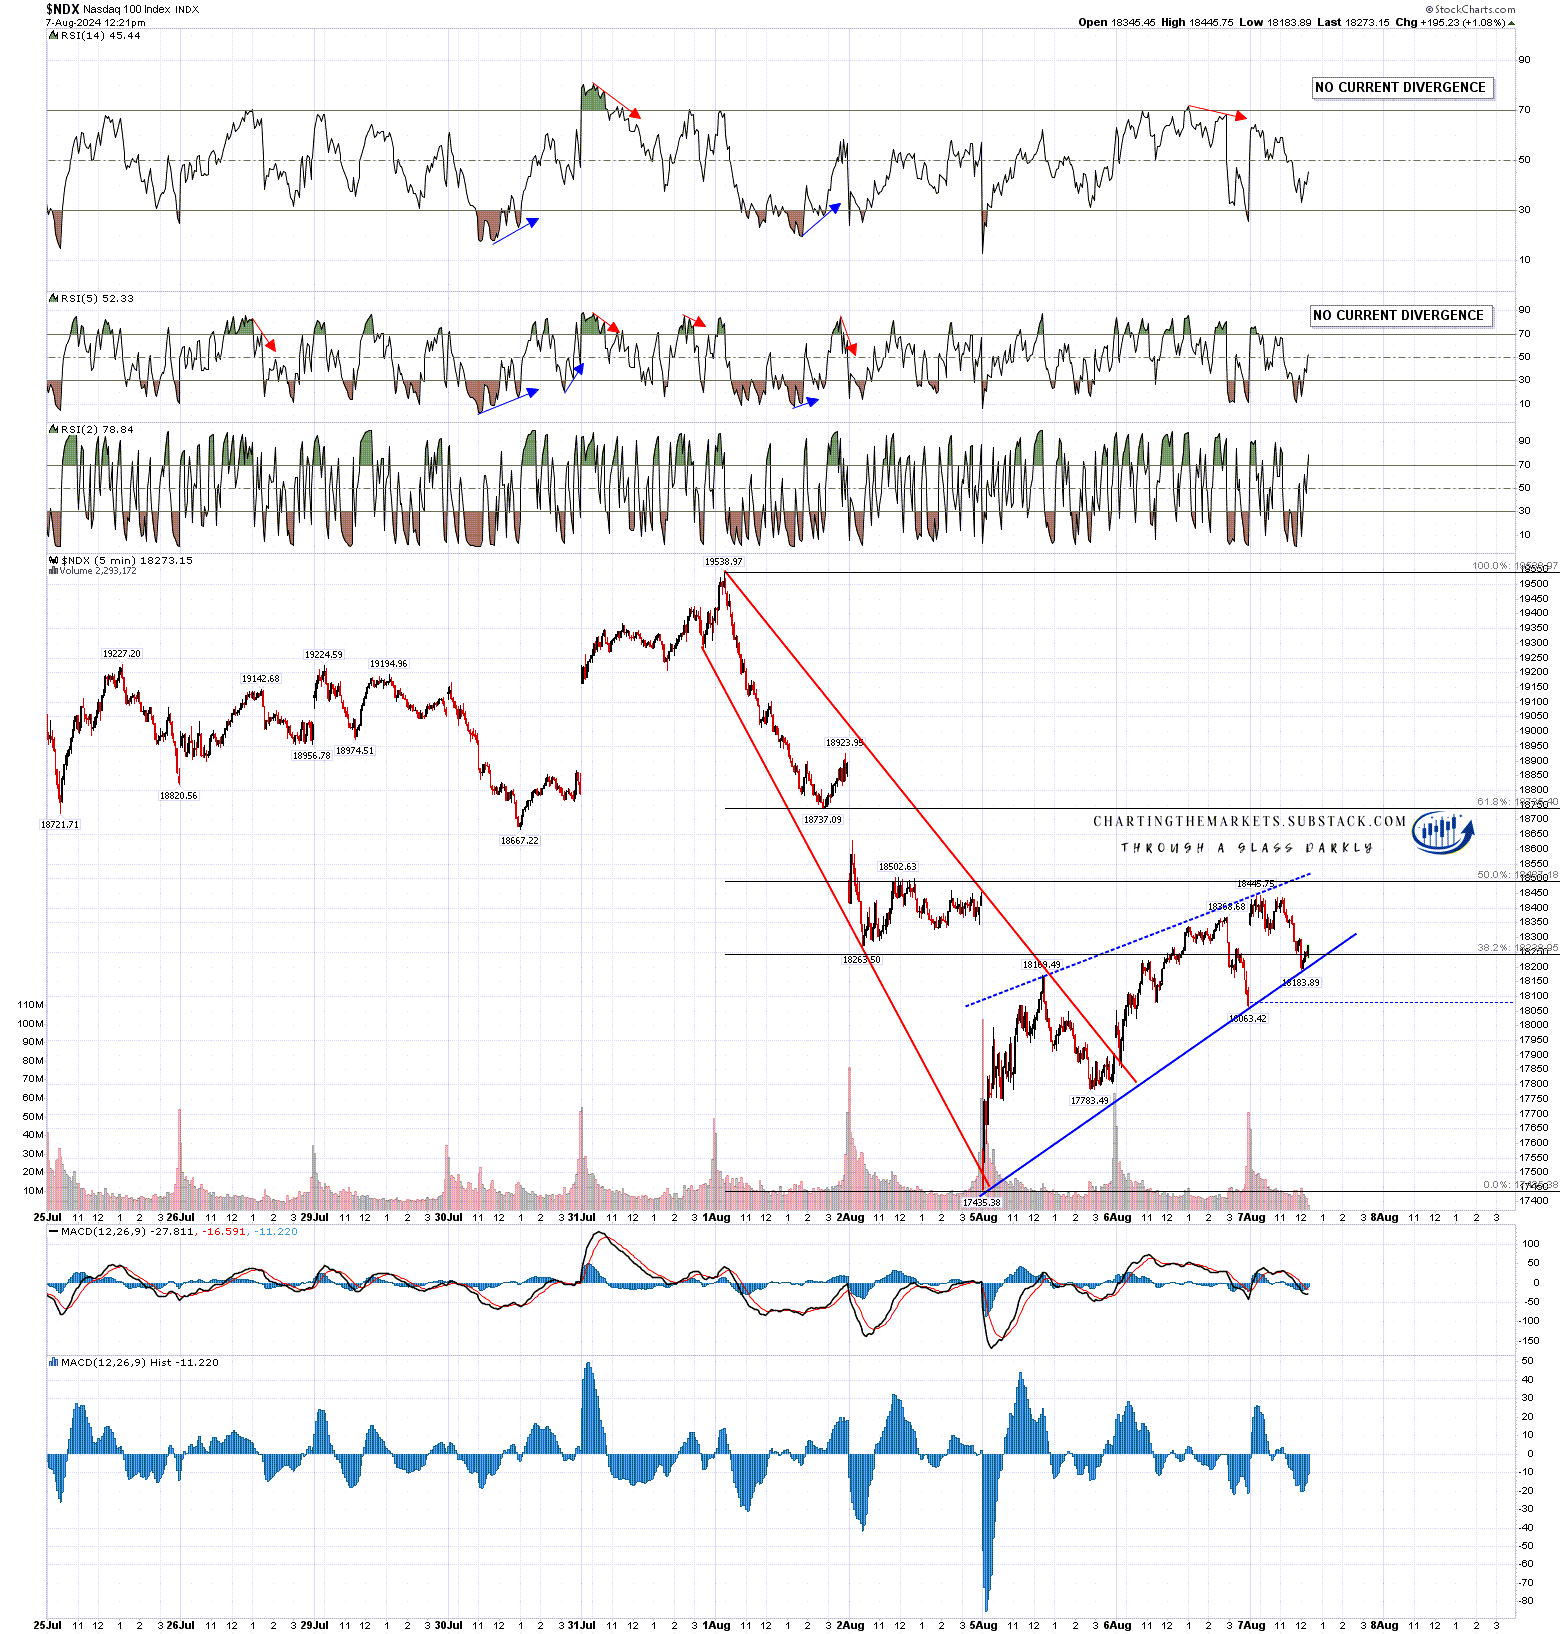
On NDX the rally has also retraced just under 50% of the decline and the pattern is a decent quality bear flag wedge.
NDX 5min chart:
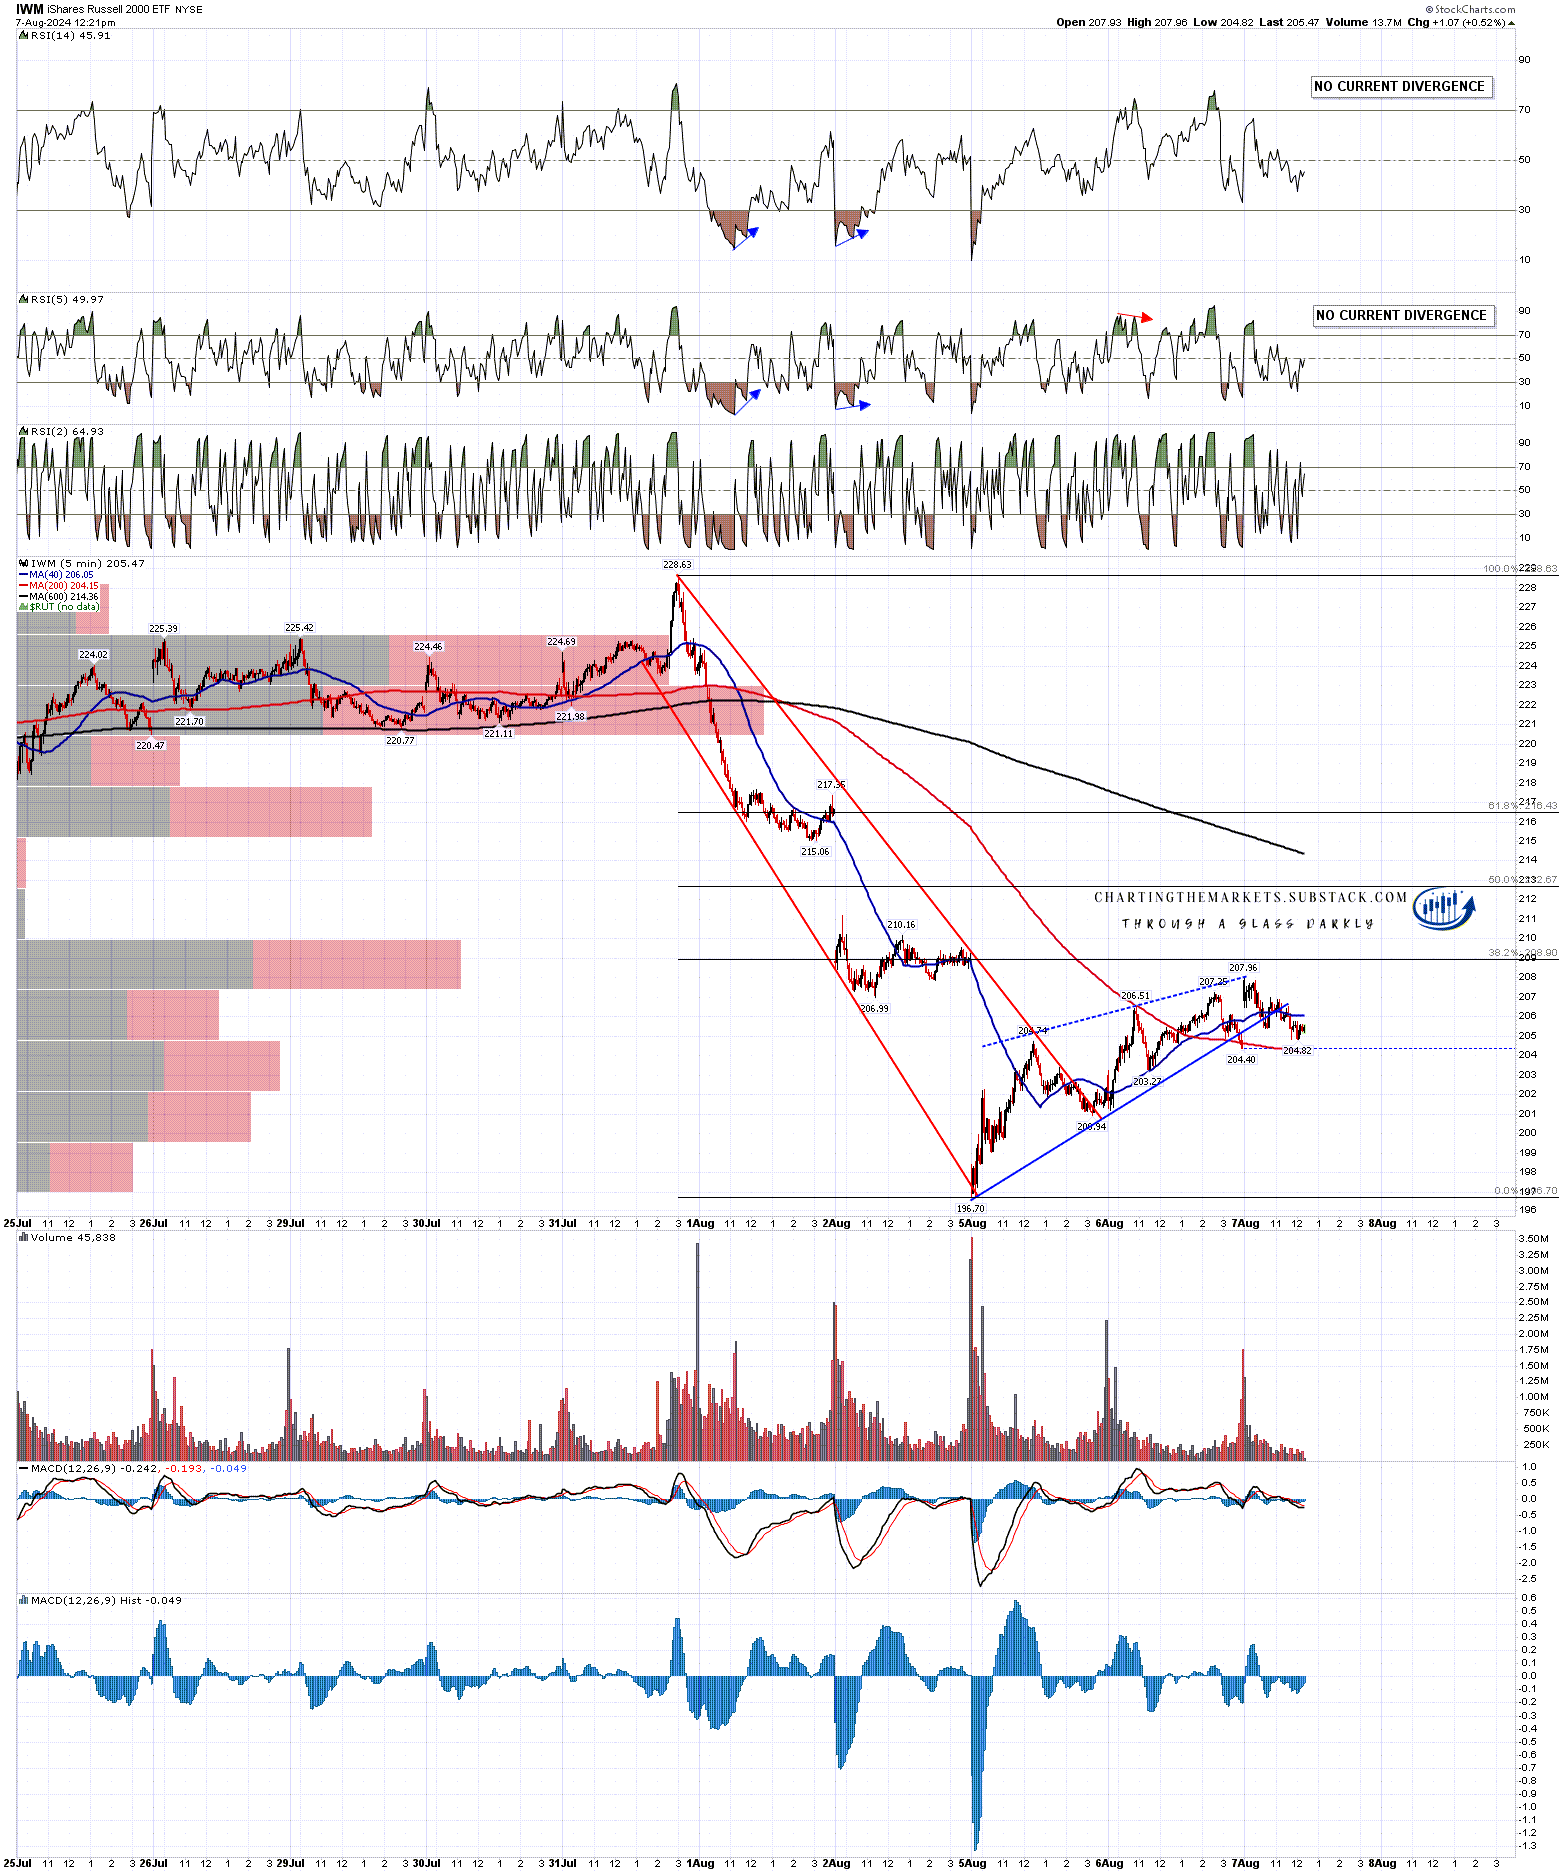
I was saying last week that unless the non-tech stocks joined the decline then it was likely to be limited, and on Friday both IWM and Dow joined the decline with enthusiasm. So far since Monday’s low they have maintained that enthusiasm, with neither having yet reached a 38.2% fib retracement of the decline. The rally pattern on IWM looks a bit messy, unless it is already starting to break down, but again it looks very much like a bear flag.
IWM 5min chart:
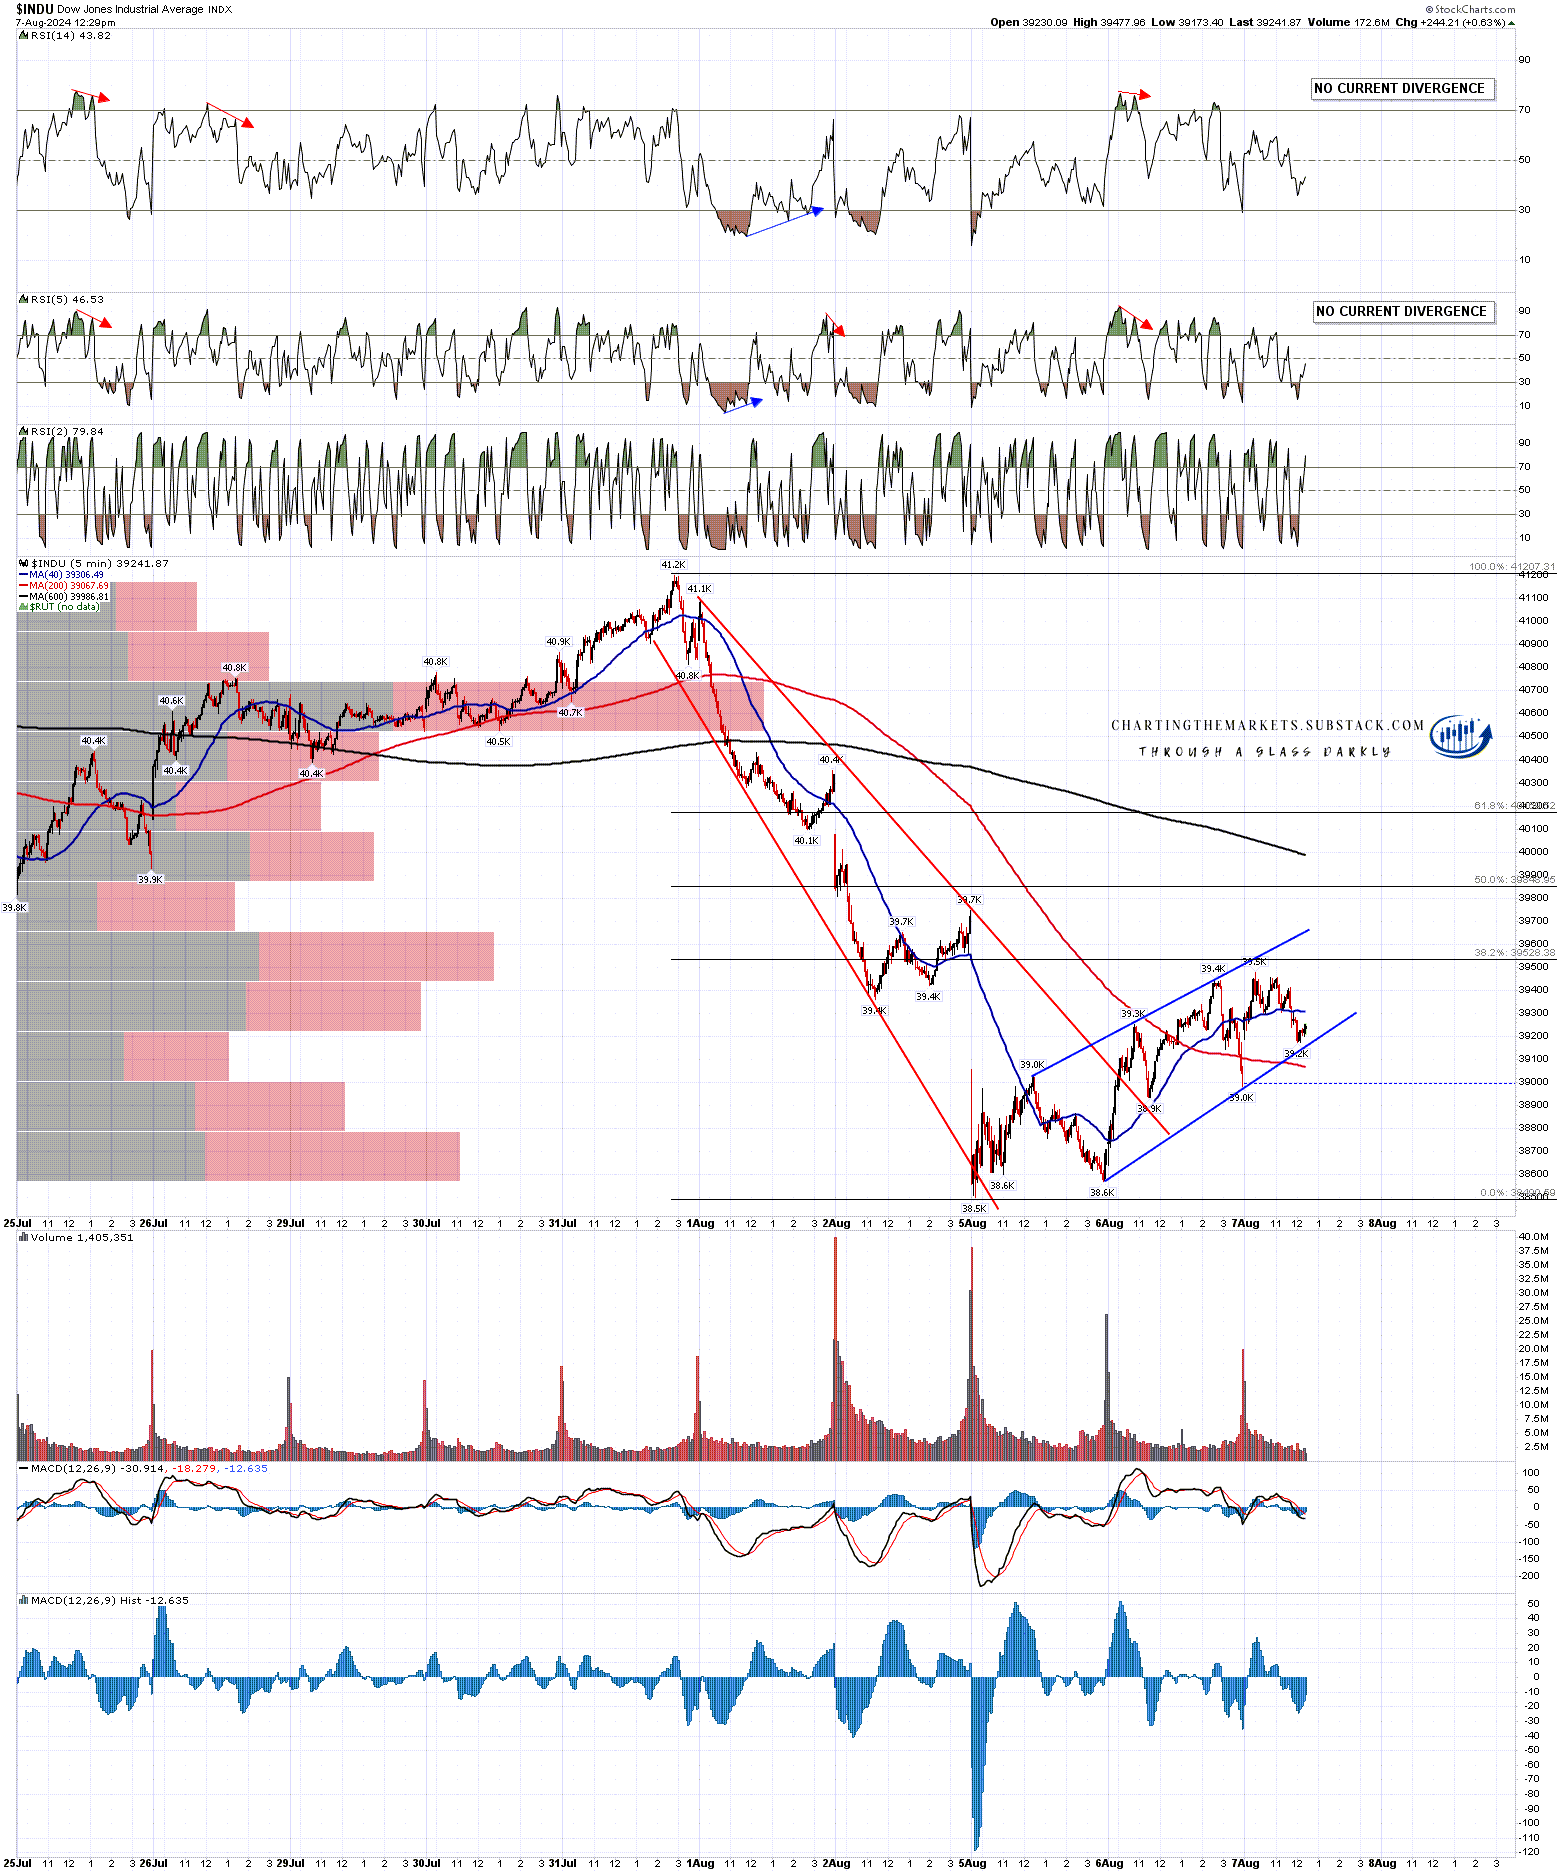
On Dow the rally pattern is a very decent looking bear flag wedge.
These four likely bear flags don’t guarantee a low retest, and the flags may go higher before they break down, but they are strongly suggesting a retest of Monday’s lows, if only to make the second lows of double bottoms, though they may well instead continue significantly lower.
INDU 5min chart:
I was saying on Monday that DAX and Nikkei were looking interesting because I had been looking at possible topping patterns on both in Chart Chat at my former website on Wednesday and Sunday last week and both of those patterns played out and made target very suddenly into the Monday lows.
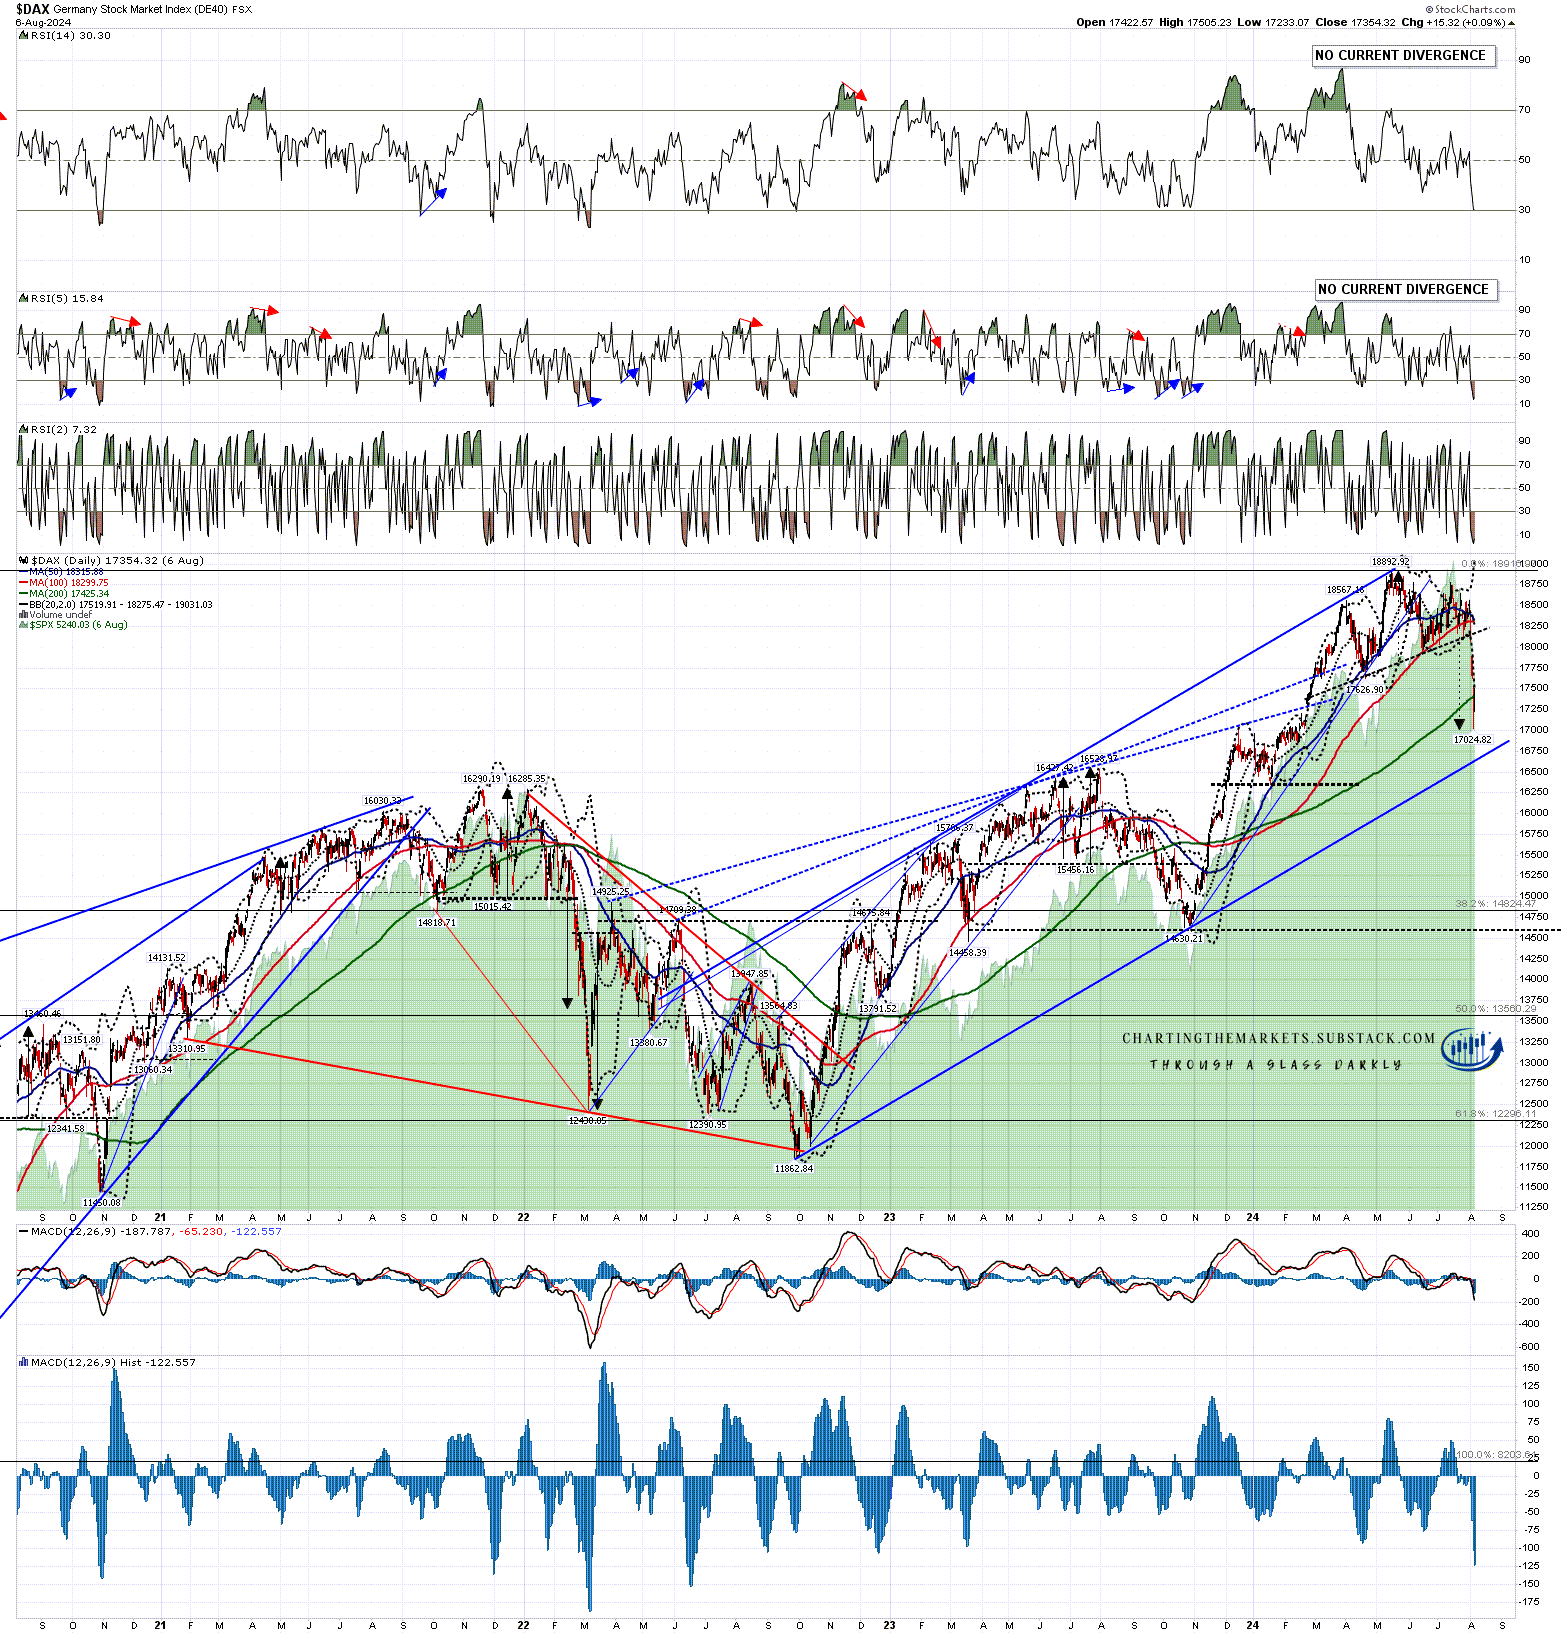
On DAX that pattern was a sharply upsloping H&S pattern that was a very nice pattern with a target in the 17000 area, and that made target with a low at 17024.82 on Monday morning.
In terms of possible lower targets there is a strong rising support trendline target currently in the 16,650 area, with the monthly middle band important support also currently in the 16,650 area, and a possible H&S neckline in the 16,350 area. I would note that the last two significant lows, both in 2023, were at tests of the monthly middle band.
DAX daily chart:
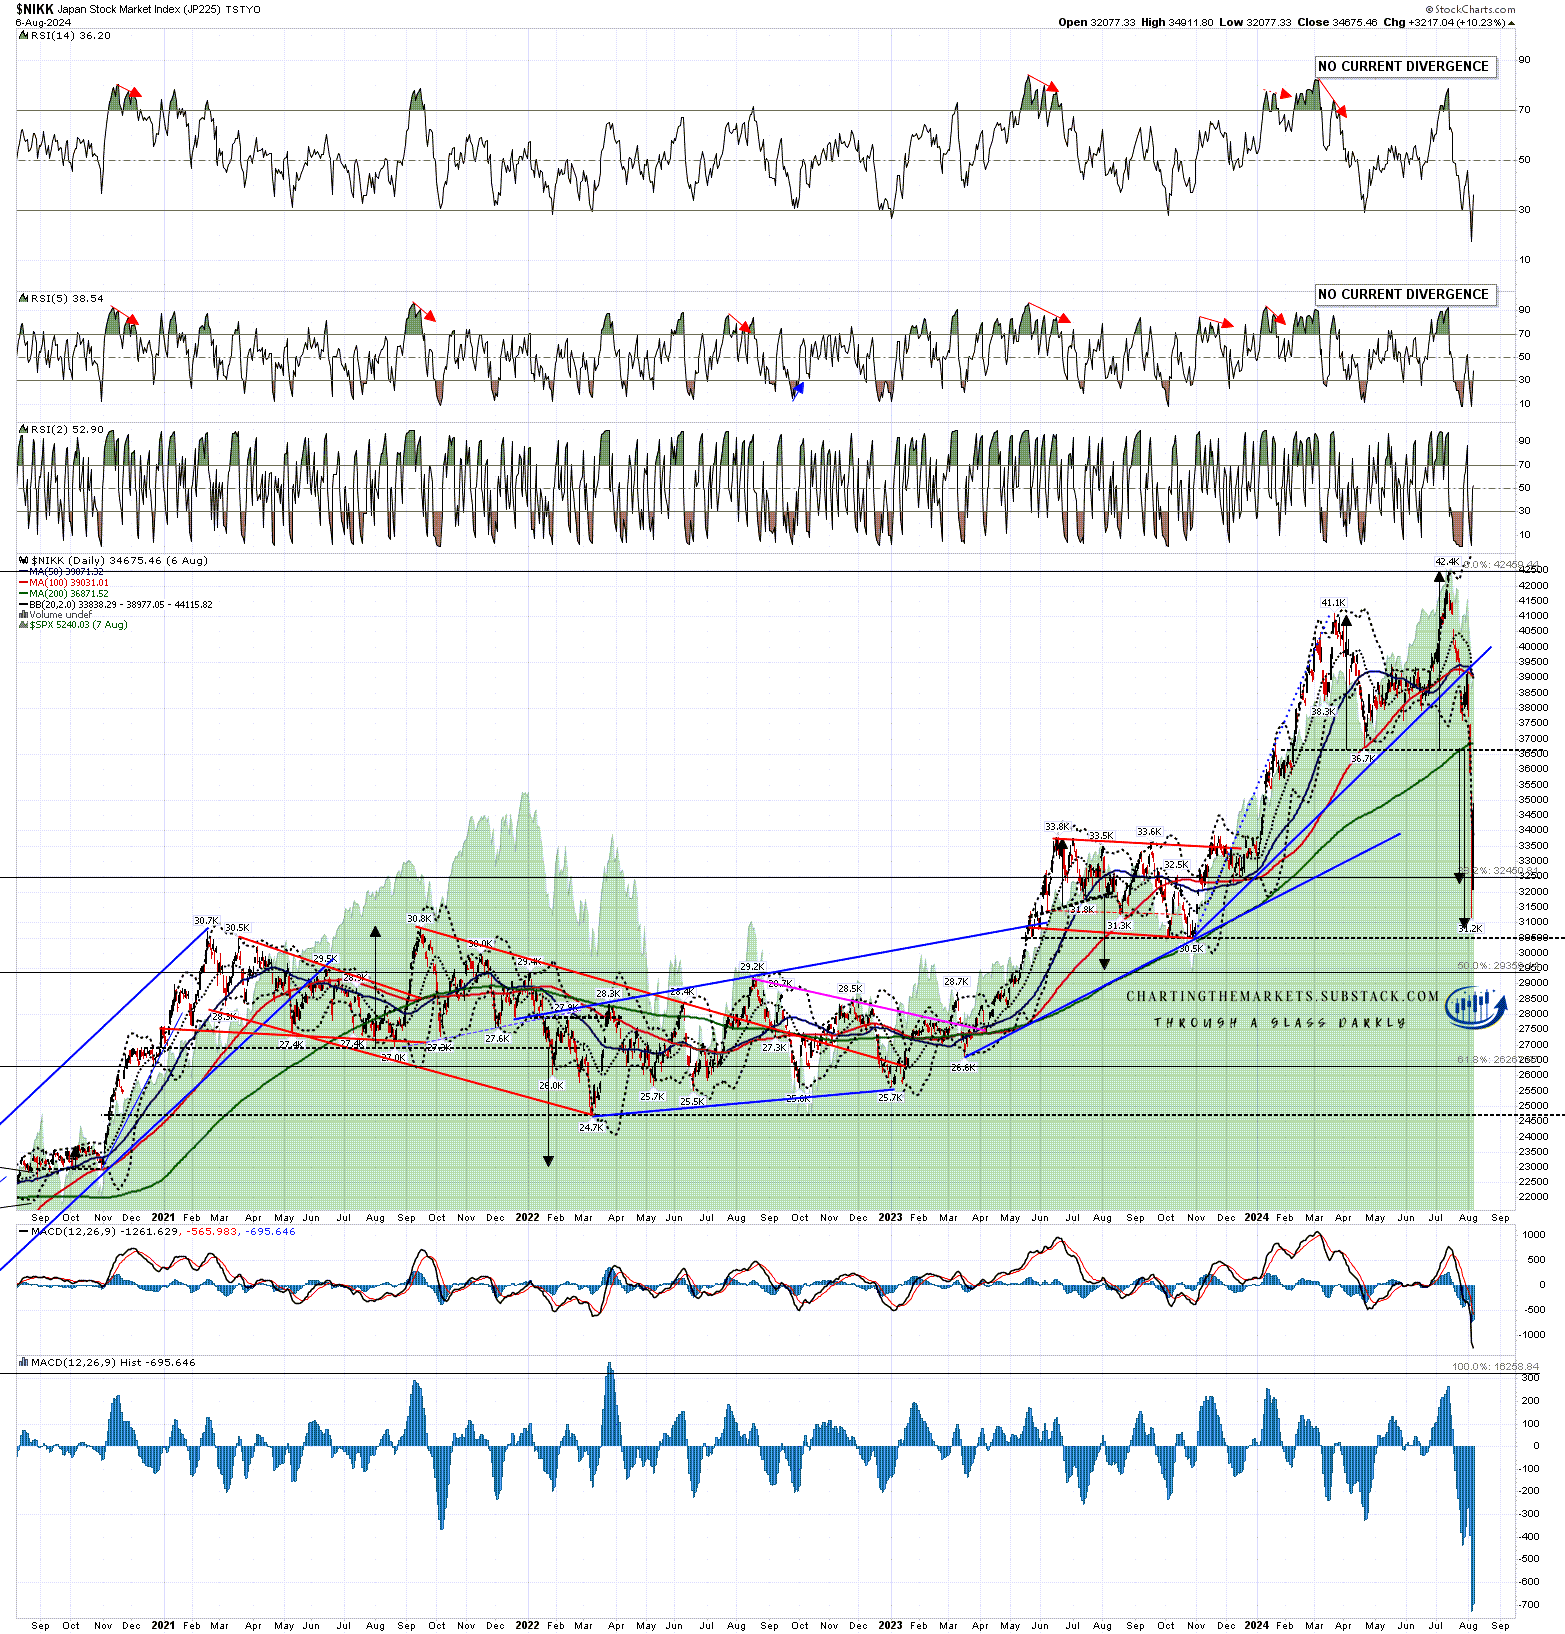
The setup on Nikkei was just as impressive. A decent quality asymmetric double target had formed over recent weeks and broke down hard on Friday. I was looking at the alternate targets in the 32,250 and 30,700 areas in Chart Chat on Sunday, and Nikkei very suddenly almost made that extended target with a low at 31.2k on Monday.
Both of these reversal patterns on DAX and Nikkei have played out now but on Nikkei I’m still watching the possible H&S neckline in the 30.5k area.
So to summarise, these pattern setups currently favor at least low retests coming soon on the US equity indices, and the chances are we will see those in coming days, though the rallies may not have peaked yet. There is a decent case for low retests on DAX and Nikkei as well of course. I’m expecting to do my next post on US indices on Friday unless tomorrow is particularly interesting.
You can now find my work at chartingthemarkets.substack.com and on my twitter (shjcharts). I’m still configuring my substacks for the rest of the week and while I’m doing that my premarket webinars are free to all, with the links posted shortly before on my twitter). I’m planning to get into a routine of doing a premarket webinar on cryptos at 8.45am EST, starting tomorrow, and a premarket webinar on equity indices and futures at 9.00am EST.
