For consideration, here are three stocks that don’t look as tho they can pass the muster to be bullish.
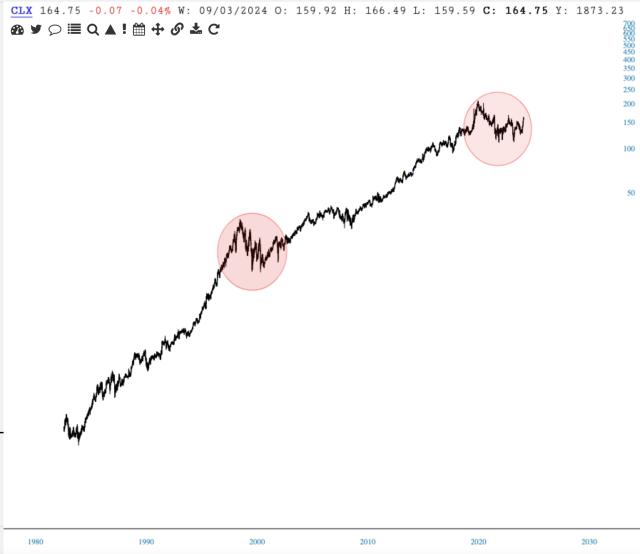
The CLX high was in August 2020 and for four years, the chart shows a crotchety mess, struggling to climb back. CLX is a WeakWilly.
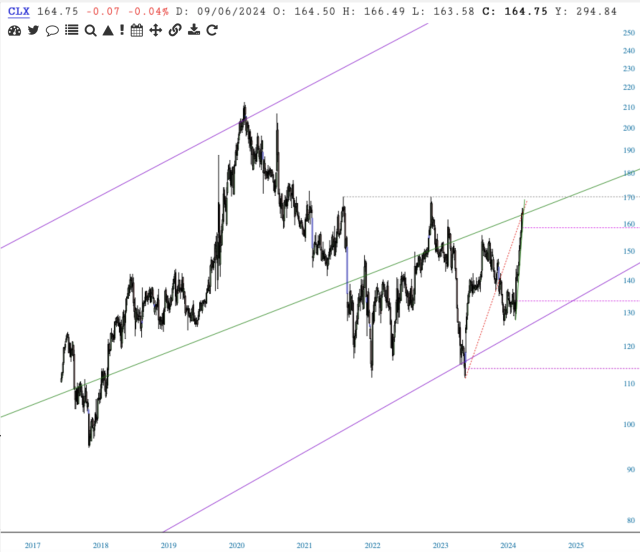
The important resistance that must be overcome is that of January 2022, 170.99. The high in May 2024 missed it by $0.20. Our September high was 166.49, falling short of the May high, 170.79, let alone, surpassing 170.99.
On this long term chart, the two circles show a period in 1999 analogous to the period from August 2020 until now. They encompass roughly the same amount of time, 4-5 years. It’s decision time.
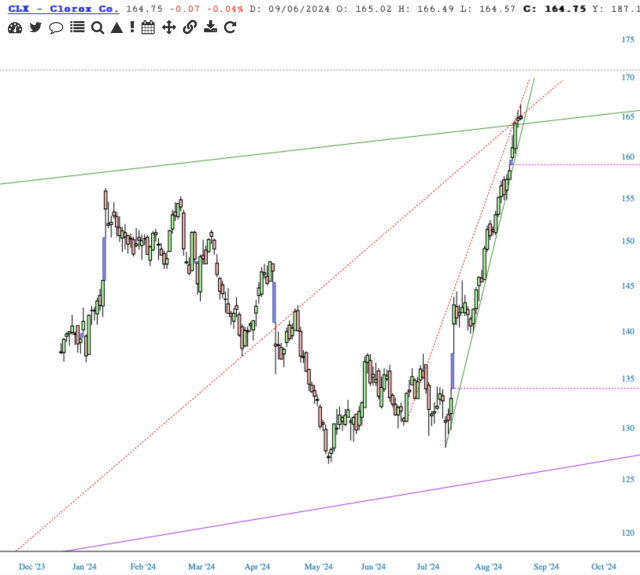
There are three lower gaps (fuchsia): a tiny one close-by and two delectable gaps further below. Watch price against support of the two green lines that we are now directly on top of. Failure there supports my bearish bias.
Next is BAC and since its double top in January and February 2022, the chart speaks of weakness. The recent failed attempts of July and now in September, spell WeakWilly. Although August provided an upward surge from the big drop in July, price has failed to overcome resistance, of which there is plenty.
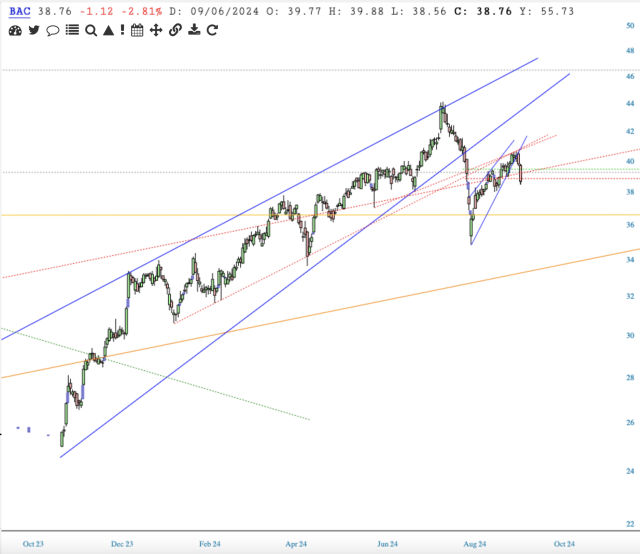
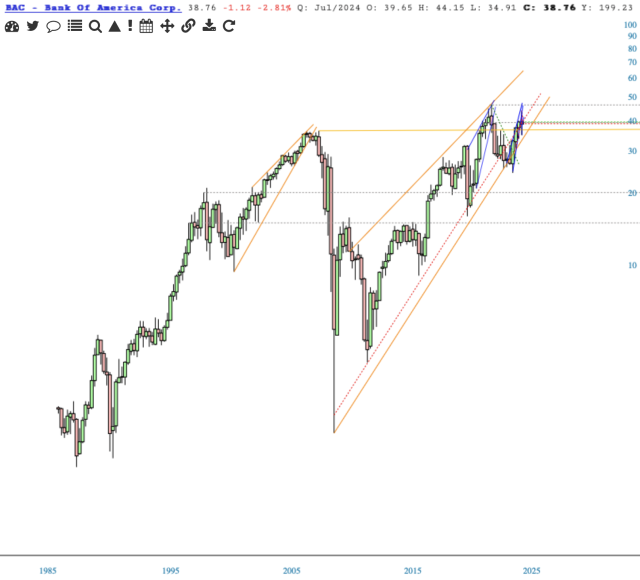
I’ve featured this stock on SocialTrade this past week because it looked vulnerable to the downside and that has played out, but BAC looks to have further to drop. Possibly much further. If price looses support of the 1997 outside high marked by the yellow horizontal, I expect a drop to 20ish.
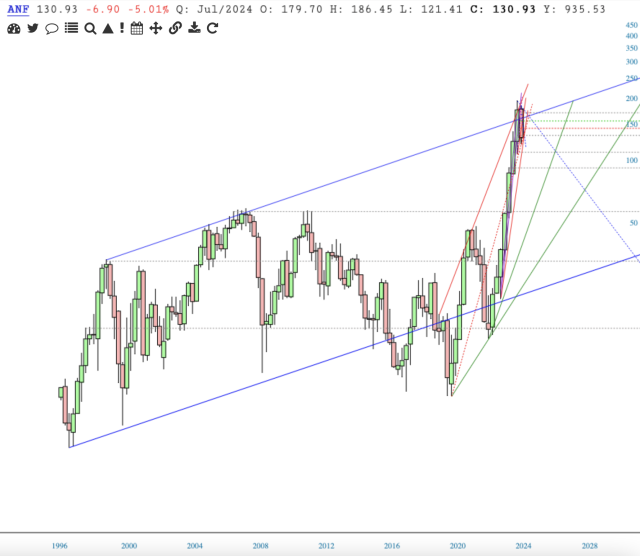
Lastly, ANF’s high was in May 2024. The lower high in August called this issue’s bullishness into question. Although August provided a resurgence, price was stopped cold, making a to-the-penny double top, and since that September high, price has a failed *h*, running away from the overhead gap.
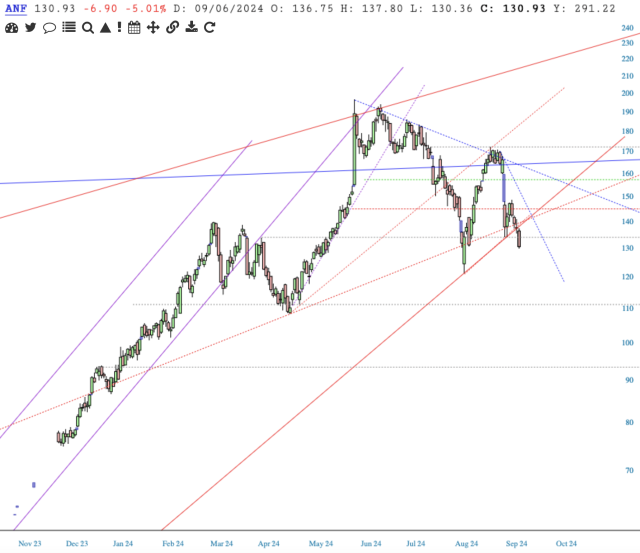
ANF looks to be headed to 60ish. What could save the bearish resolve? Price making support out of Both dotted blue lines of resistance (on Daily above), which for this WeakWilly, is asking too much.