Using Relative Strength Index (RSI) Last Week
We had no trade exits last week, so in lieu of an Exits post, let’s talk about a technical indicator. One of the indicators that made the materials stock in our Friday trade alert attractive was its low RSI (at about 20).

Speaking of which, please note the update to the trade part of that post.
RSI also kept us out of one trade last week that wouldn’t have gone well. That was a bearish earnings trade on the online apparel company Stich Fix (SFIX 0.00%↑).
Recall the metrics we’ve been using when selecting earnings trades:
- LikeFolio’s earnings score based on social data. The higher the number, the more bullish, the lower (more negative) the number, the more bearish. SFIX had an earnings score of -32 last week.
- Portfolio Armor’s gauge of options market sentiment. PA was neutral on SFIX last week.
- Chartmill’s Setup rating. On a scale of 1-10, this is a measure of technical consolidation. For bullish trades, we want a high setup rating; for bearish trades, a lower one. SFIX had a setup rating of 3.
- Zacks Earnings ESP (Expected Surprise Prediction). This is a ratio of the most accurate analyst’s earnings estimate versus the consensus estimate. SFIX had a Zacks ESP of 0% (neutral).
- The Piotroski F-Score. A measure of financial strength on a scale from 0-9, with 9 being best. SFIX had an F-Score of 4.
- Recent insider transactions. SFIX had open market sales this year and no open market buys.
- RSI (Relative Strength Index). A technical measure of whether a stock is overbought or oversold. We’re looking for RSI levels below 70 for bullish trades and above 30 for bearish ones. SFIX had an RSI of 29.
So, of the first six indicators there, 4 were bearish on SFIX and 2 were neutral. Based on that, we would have bet against the stock, but since its RSI suggested it was oversold, we passed.
As you can see in the chart below, SFIX spiked last Tuesday after reporting mixed earnings (though it gave up those gains by the end of the week and ended basically flat).

RSI also offers an opportunity to trade stocks post-earnings.
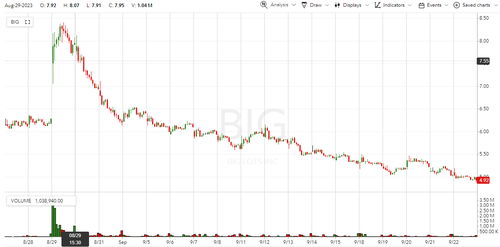
We successfully bet against the discount retailer Big Lots (BIG 0.00%↑) over the summer,

But its short-lived bounce after its not-great earnings last month offered another opportunity to bet against it.