Although technical analysis is the basis of the Slope of Hope, there is still something to be said for actual profits and losses when it comes to corporate performance. We have decades of information regarding corporate earnings dates, projected quarterly results, and actual quarterly resorts, all presented in a clear, easy-to-use chart.
The historical earnings performance page is located here, and all you need to do is enter the ticker symbol of interest and click Go. The chart will show you all of the information in our database, plotted as expected earnings (in blue) and actual earnings (in black).
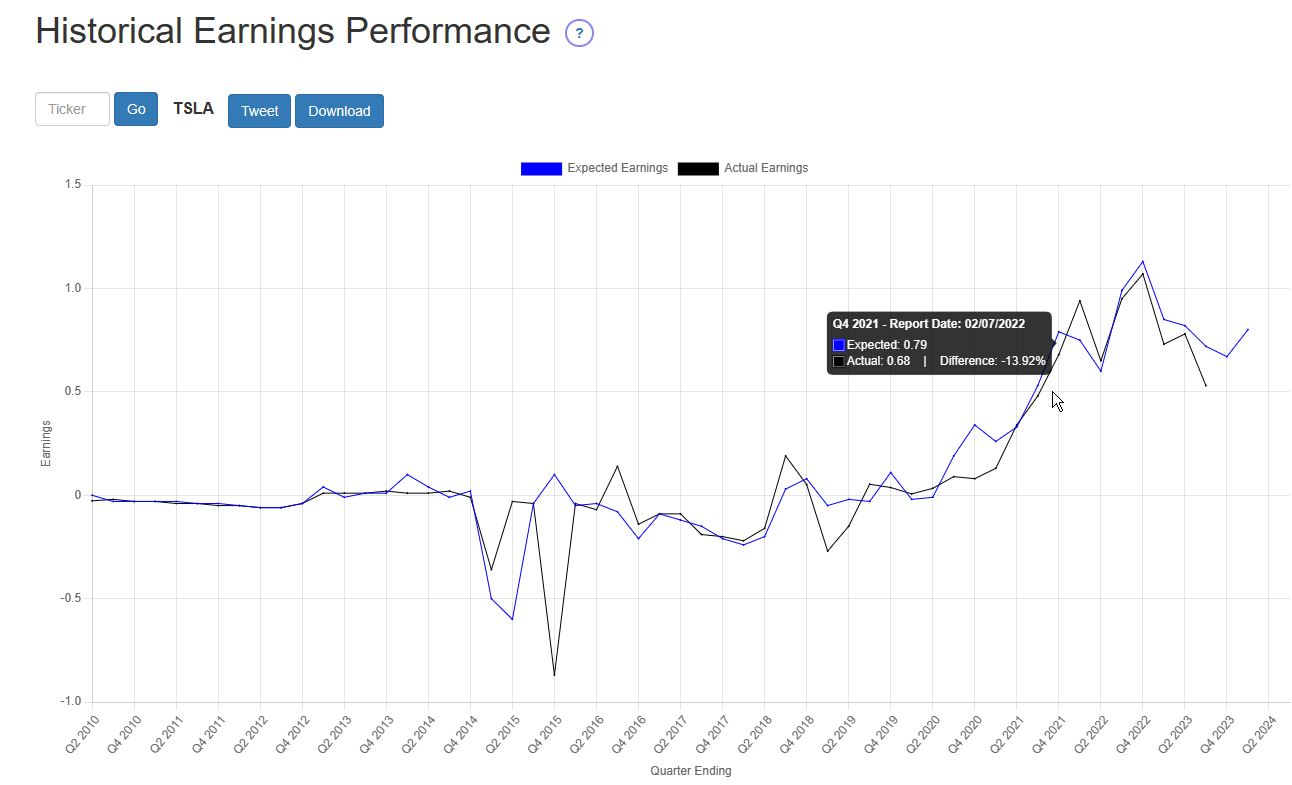
You can point to any portion of the chart to see, to the penny, what the expected and actual earnings were, what quarter you are examining, and what the difference (either positive or negative) percentage was when the expectations and actual performance are compared.
You can also zoom in to any portion of the chart by swiping across the zone you want to examine with your mouse. To “un-zoom”, as with SlopeCharts, just double-click the mouse button.