
There is a new feature on Slope, presently available to everyone, and it’s in beta form now, ready for testing. I encourage you to try it out and let me know any issues you find or feedback you’ve got. Slope of Hope’s Power Screener allows you to quickly and easily discover the stocks which meet parameters you define. The page itself is located here.
The page is exceptionally easy to use. You establish what parameters you want to use in your quest for a trading opportunity. The parameters can be oriented to the stock’s liquidity, its dividend yield, its recent price action or the behavior of its moving averages. As you can changing the parameters, the number of results updates in real time so you can create enough filters to establish a manageable size of securities to examine.
To screen for equities, slide either circular control for each slider bar to define the parameters for that particular property. You can either use your mouse to drag the small circles left and right, or, after you’ve clicked a circle, use the left and right arrows on your keyboard to “nudge” the item by just one unit higher or lower.
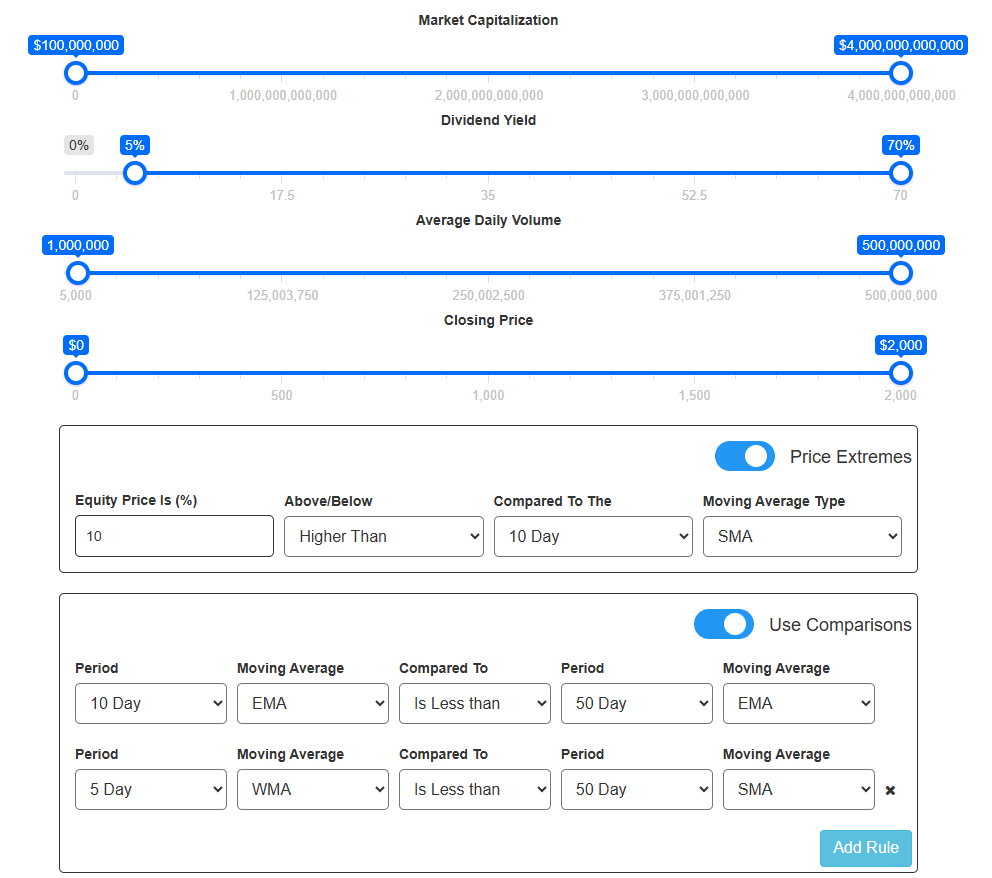
The sliders related to the database’s basic parameters are as follows:
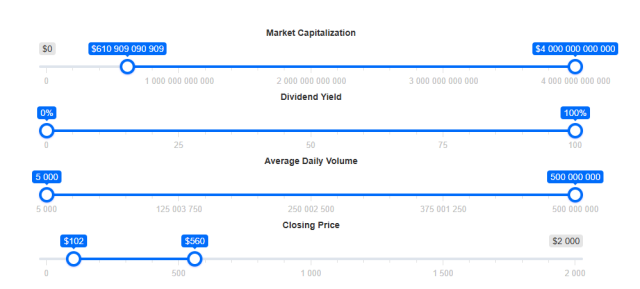
These sliders help you define the following:
- Market Capitalization: the total value of all the company’s stock
- Dividend Yield: the interest paid to shareholders annually
- Average Daily Volume: the average volume of the stock over the past 200 trading days
- Closing Price: the most recent closing price of the stock
As you make any adjustment, the value in the Display Results button will update, allowing you to see in (almost) real time how many stocks meet the parameters you have established. You must use enough parameters to get the quantity below 500 in order to see any results.
If you want more precision, you can click on the circle itself and hand-enter the value you want to use.
Perhaps the most useful element of the screener is the ability to seek out stocks which have made outsized moves relative to their own moving averages. You can access this by turning on the Price Extremes toggle, which will present to you these elements:
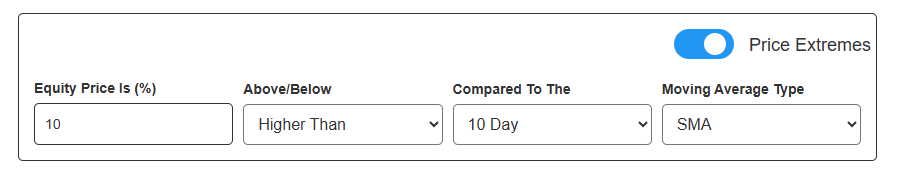
Using this portion of the screener is somewhat like composing a sentence to express what you are interested in seeing. From left to right, the elements are:
- Equity Price (%) – this is the percentage you are seeking. The higher number, the more “extreme” the move, because you are establishing the relative distance between the most recent price and the moving average.
- Above/Below – here you state whether you are interested in prices below (weakening) or above (strengthening) the moving average.
- Compared To The – this is where you choose the period to use for the moving average, from very fast-changing (5-day) to very slow (200-day).
- Moving Average Type – there are three choices for what moving average to use: simple (SMA), weighted (WMA), and exponential (EMA)
Once you have fewer than 500 symbols that qualify based on the parameters you have set out, the View Results button will do just that: show you information about the qualifying symbols.
The information displayed is extensive:
- symbol, which is hyperlinked to its Super Summary
- company name
- market capitalization
- dividend yield
- price/earnings ratio
- average volume for the past 200 trading days
- most recent price
- company’s industry
- company’s sector within that industry
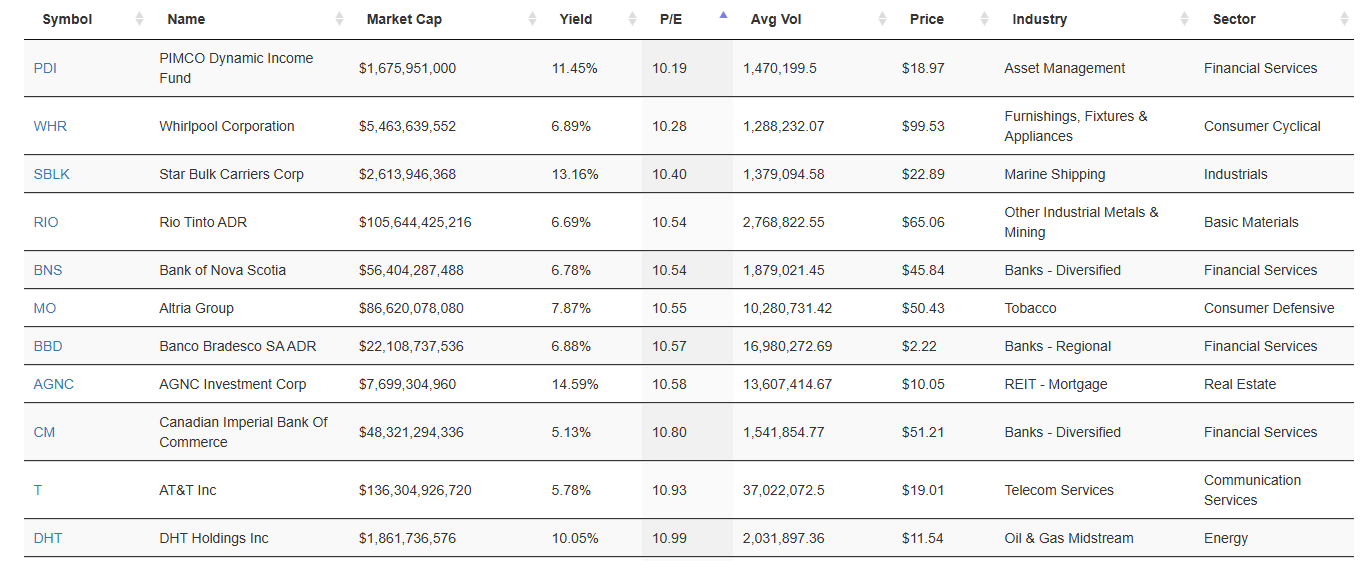
Clicking any of the column headers will toggle the sort for the data beneath. That is to say, you can sort ascending or descending (alternately) by clicking the header name at the very top.
If you have results to view, you will be presented with four buttons you can use to do something with those results:

The functions these carry out are:
- Copy to Clipboard: Copies all the text from the results into your clipboard, which you can paste into any other application;
- Export Excel: lets you save a file with the name and location of your choice which can be opened by Microsoft Excel;
- Print Data: prints out the data you are viewing;
- Export Symbols: unlike the other buttons, this only exports the symbols (instead of all the other information) into a .txt file which you can use, for example, to Import the symbols into a SlopeCharts watchlist.
