
There was a strong move down yesterday, with the small double-top target I gave in the morning made shortly after the open. Nonetheless it could be that the short term high is not yet in, as the first strong move down often sets up a topping pattern, and we might still therefore see a test of the highs before the retracement really gets going. This possibility is best shown on the ES 60min chart where a possible double-bottom has triggered with a target in the 1839.50 area. There is strong resistance just above at the 50 hour MA in the 1832.75 area and broken support at 1833.25. If those levels are broken with confidence then that 1839.50 target should be made and we might well then see a retest of the highs. ES 60min chart:

On the SPX 60min chart I’d just like to mention why I am looking for a strongish retracement into the 1800-10 area, and the main reason for that is the strong resistance trendline above SPX at the moment. You can have an unmatched rising support trendline in an uptrend, but to see an unmatched rising resistance trendline in an uptrend is rare. I’m looking for the matching support trendline and the most likely (and closest) candidate is the possible rising support trendline from the October low. SPX 60min chart:

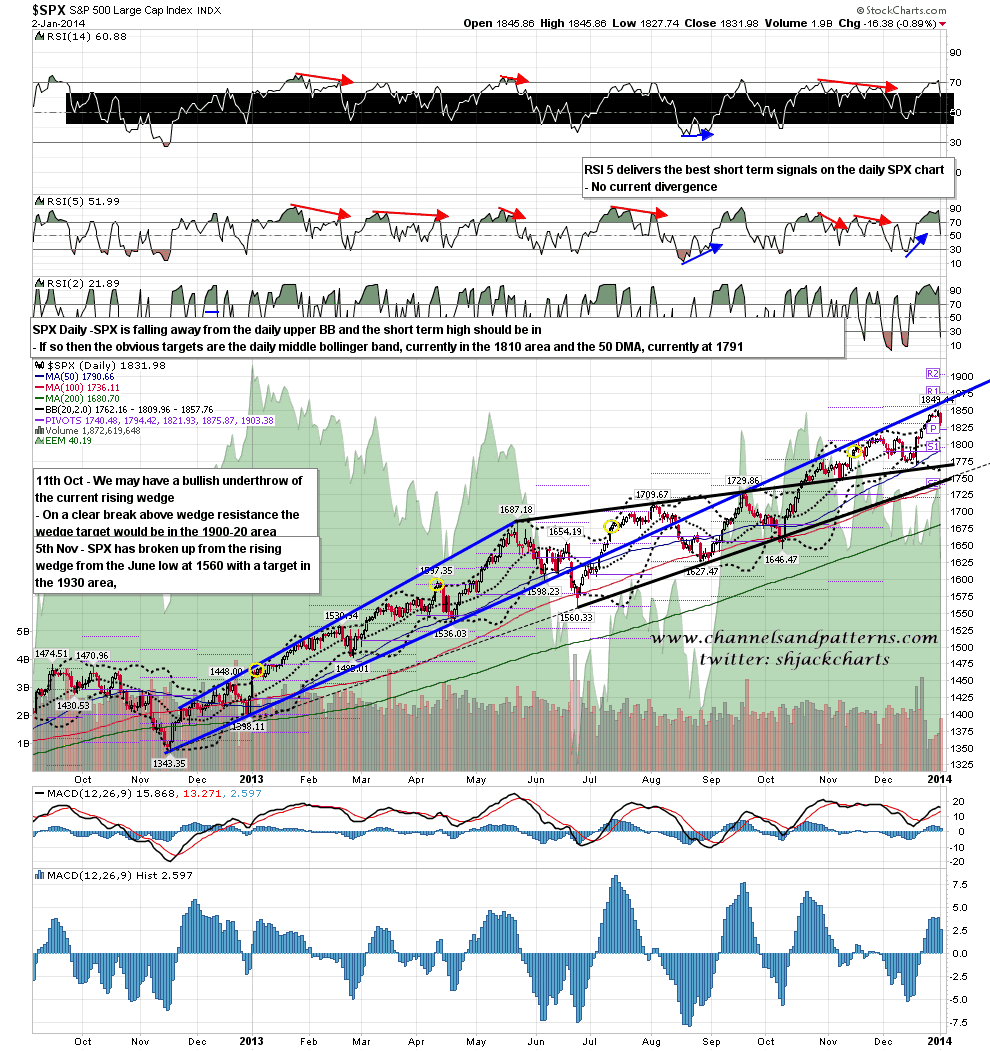
On the SPX daily chart the obvious support level to be tested here is the middle bollinger band (now at 1811) and just below that is the 50 DMA (now at 1791). The 50 DMA would be the best fit with my trendline target. SPX daily chart:
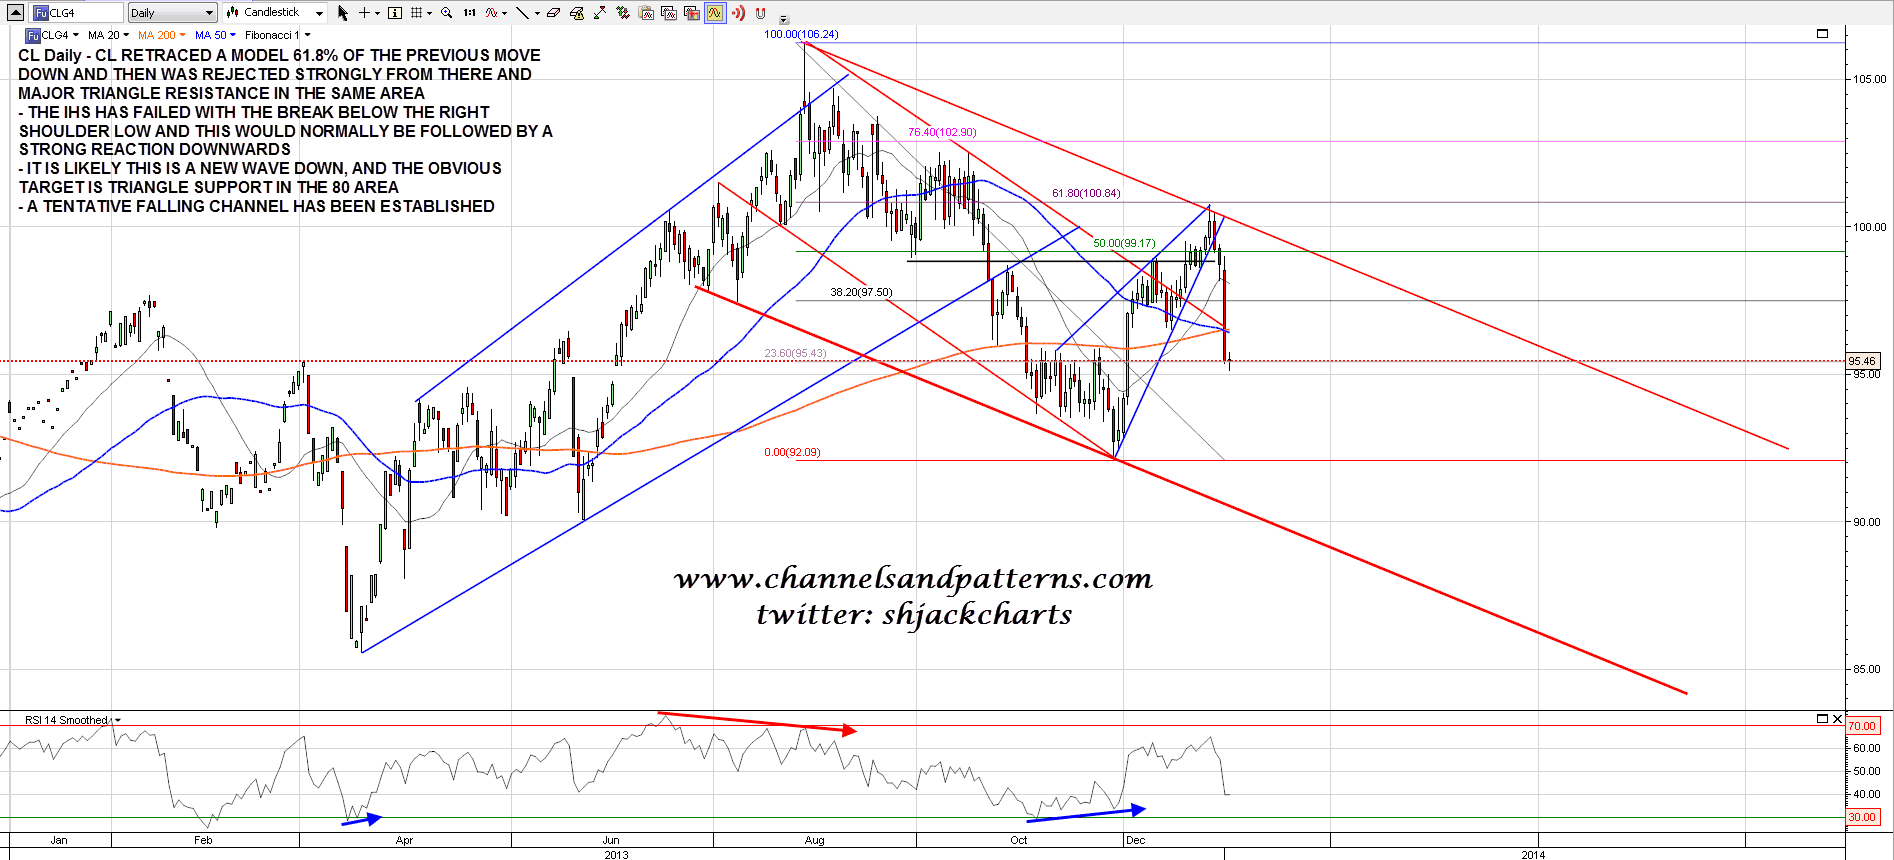
As I mentioned as a possibility yesterday morning, CL rejected hard at triangle resistance and the 61.8% fib retracement. The move pushed CL below the IHS right shoulder, which has now most likely failed, which would normally be followed by a strong further push down. As I mentioned yesterday morning, the obvious next target is triangle support in the 80 area. CL daily chart:
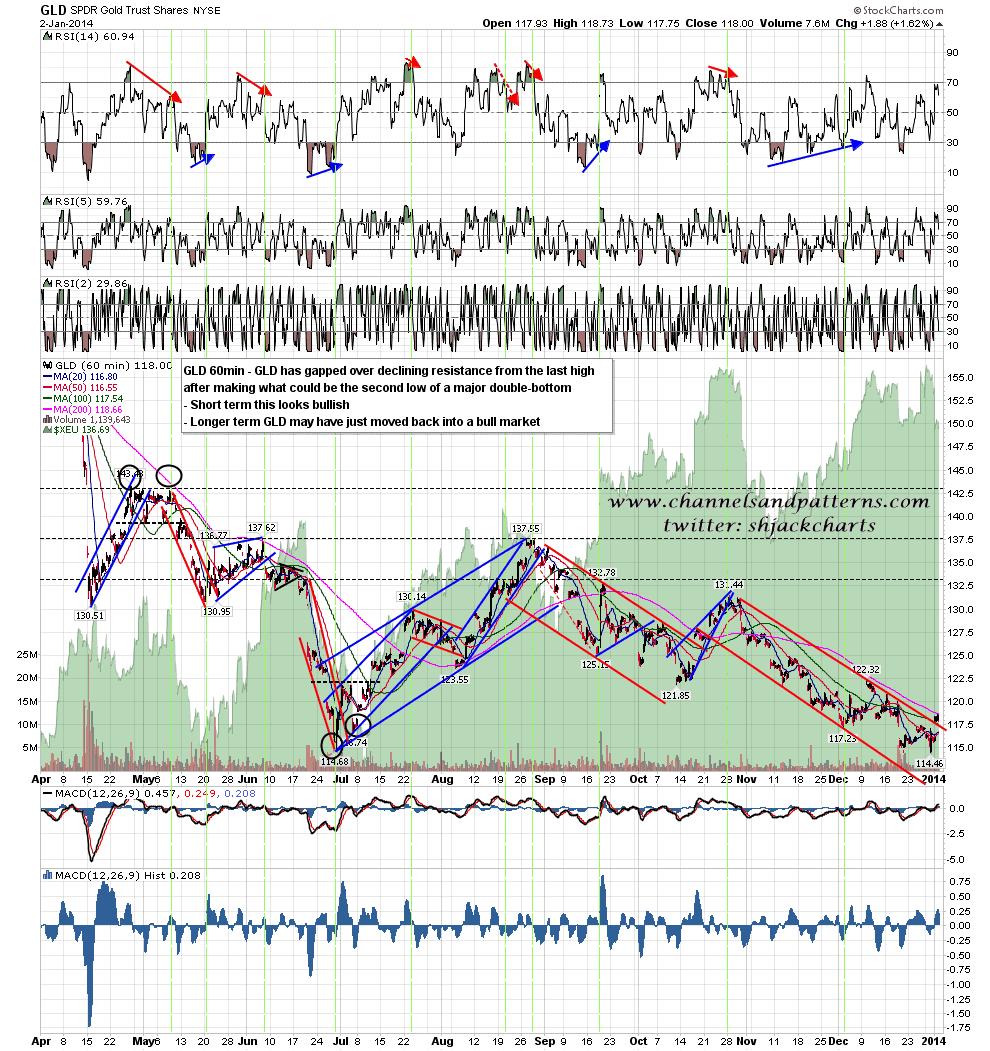
I’ve been talking for months about the possibility that gold would make a double-bottom to finish of the current bear market in precious metals. A very nice looking second low has now been made for that double-bottom and GLD has now gapped over declining resistance from the last high. That looks short term bullish, and longer term gold may be back in a new bull market if it can break back over primary resistance at the 150 DMA in the 1300 area. GLD 60min chart:
I posted a chart a few days ago showing AAPL at an important inflection point and it’s still there. I have marked the important pattern options and the support and resistance levels on the chart. AAPL 60min chart:

I’m leaning bearish today unless bulls can break back with confidence over 1833.25 ES and hold it as support. If that happens I would then be leaning bullish and looking for a possible retest of the highs to set up what would most likely be a larger double-top.
