
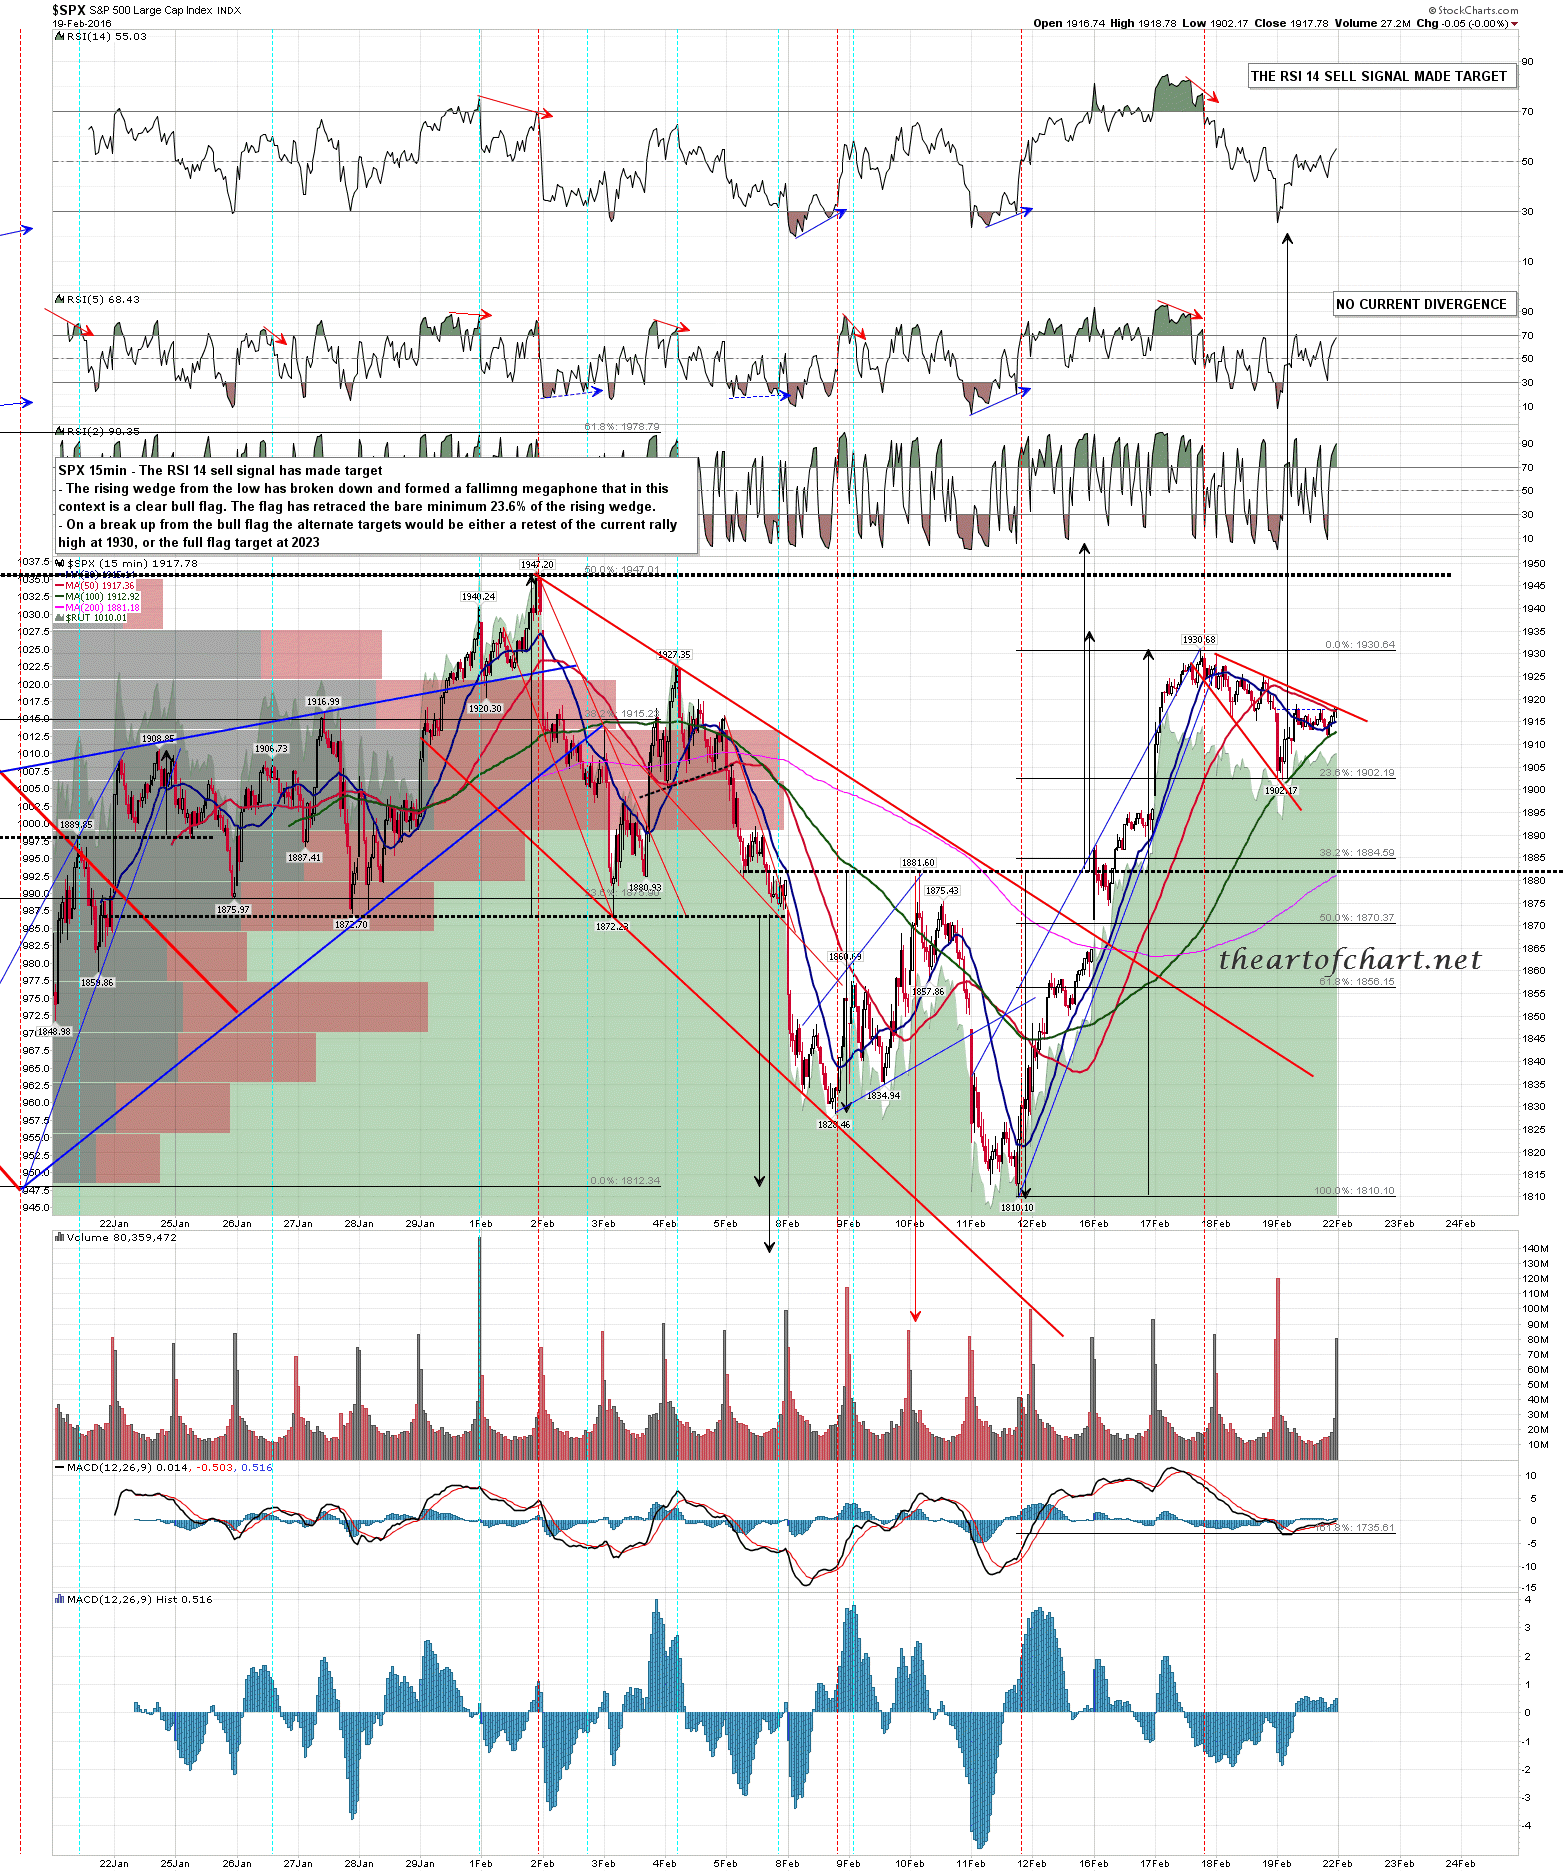
SPX retraced to the bare minimum 23.6% fib retracement on Friday while forming a bull flag. That bull flag broke up overnight, and if new rally highs are sustained this morning, SPX should be on the way to test either the 50% fib retracement at 1963 or the 61.8% fib retrace at 2000. SPX 15min chart:
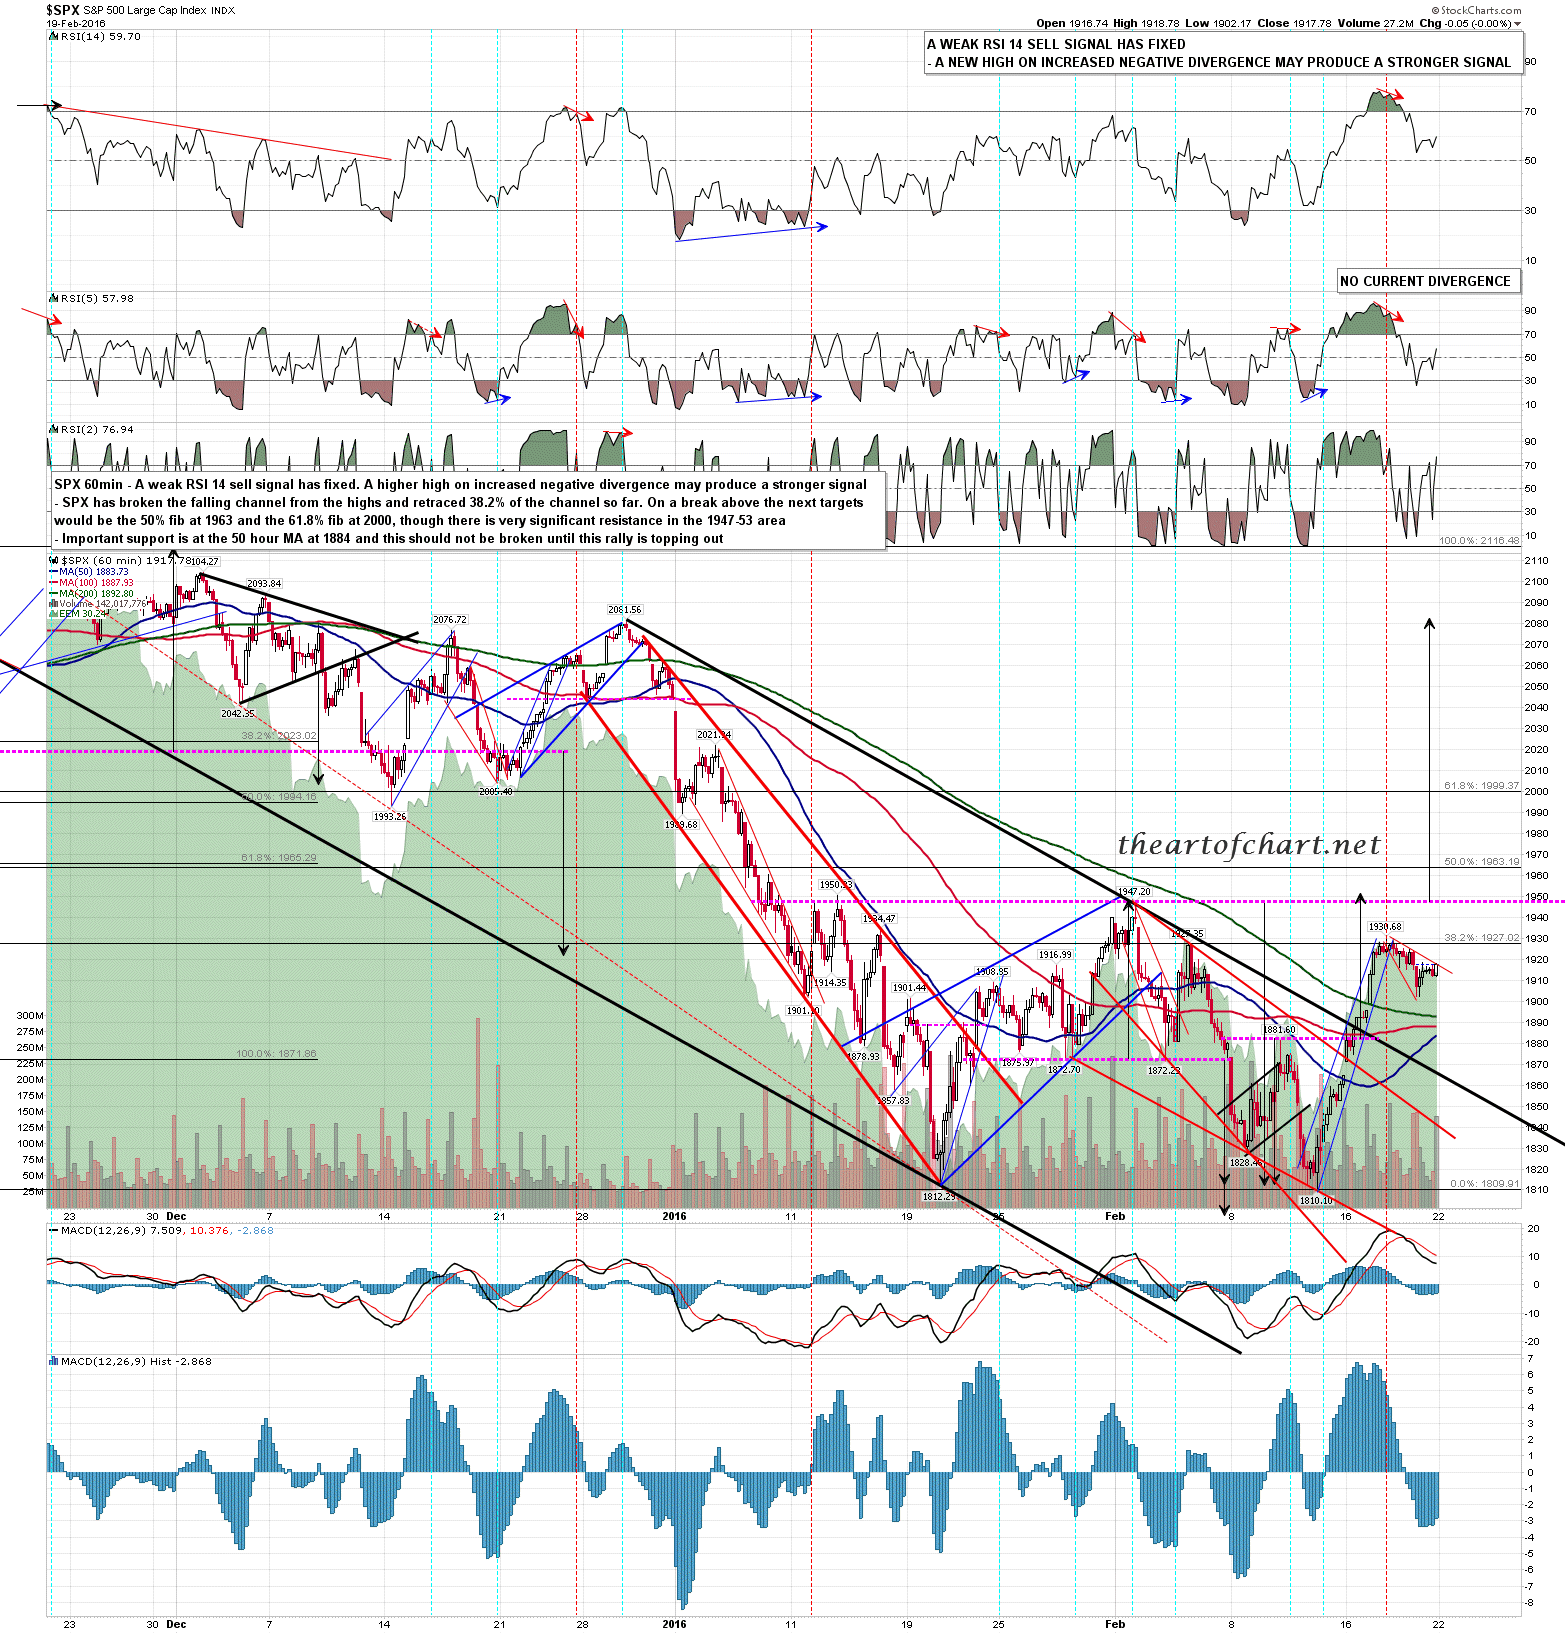
When reached there is possible resistance at the last rally high in the 1947 area. That is a possible IHS neckline so a big reversal there could mean that an IHS is forming. SPX 60min chart:
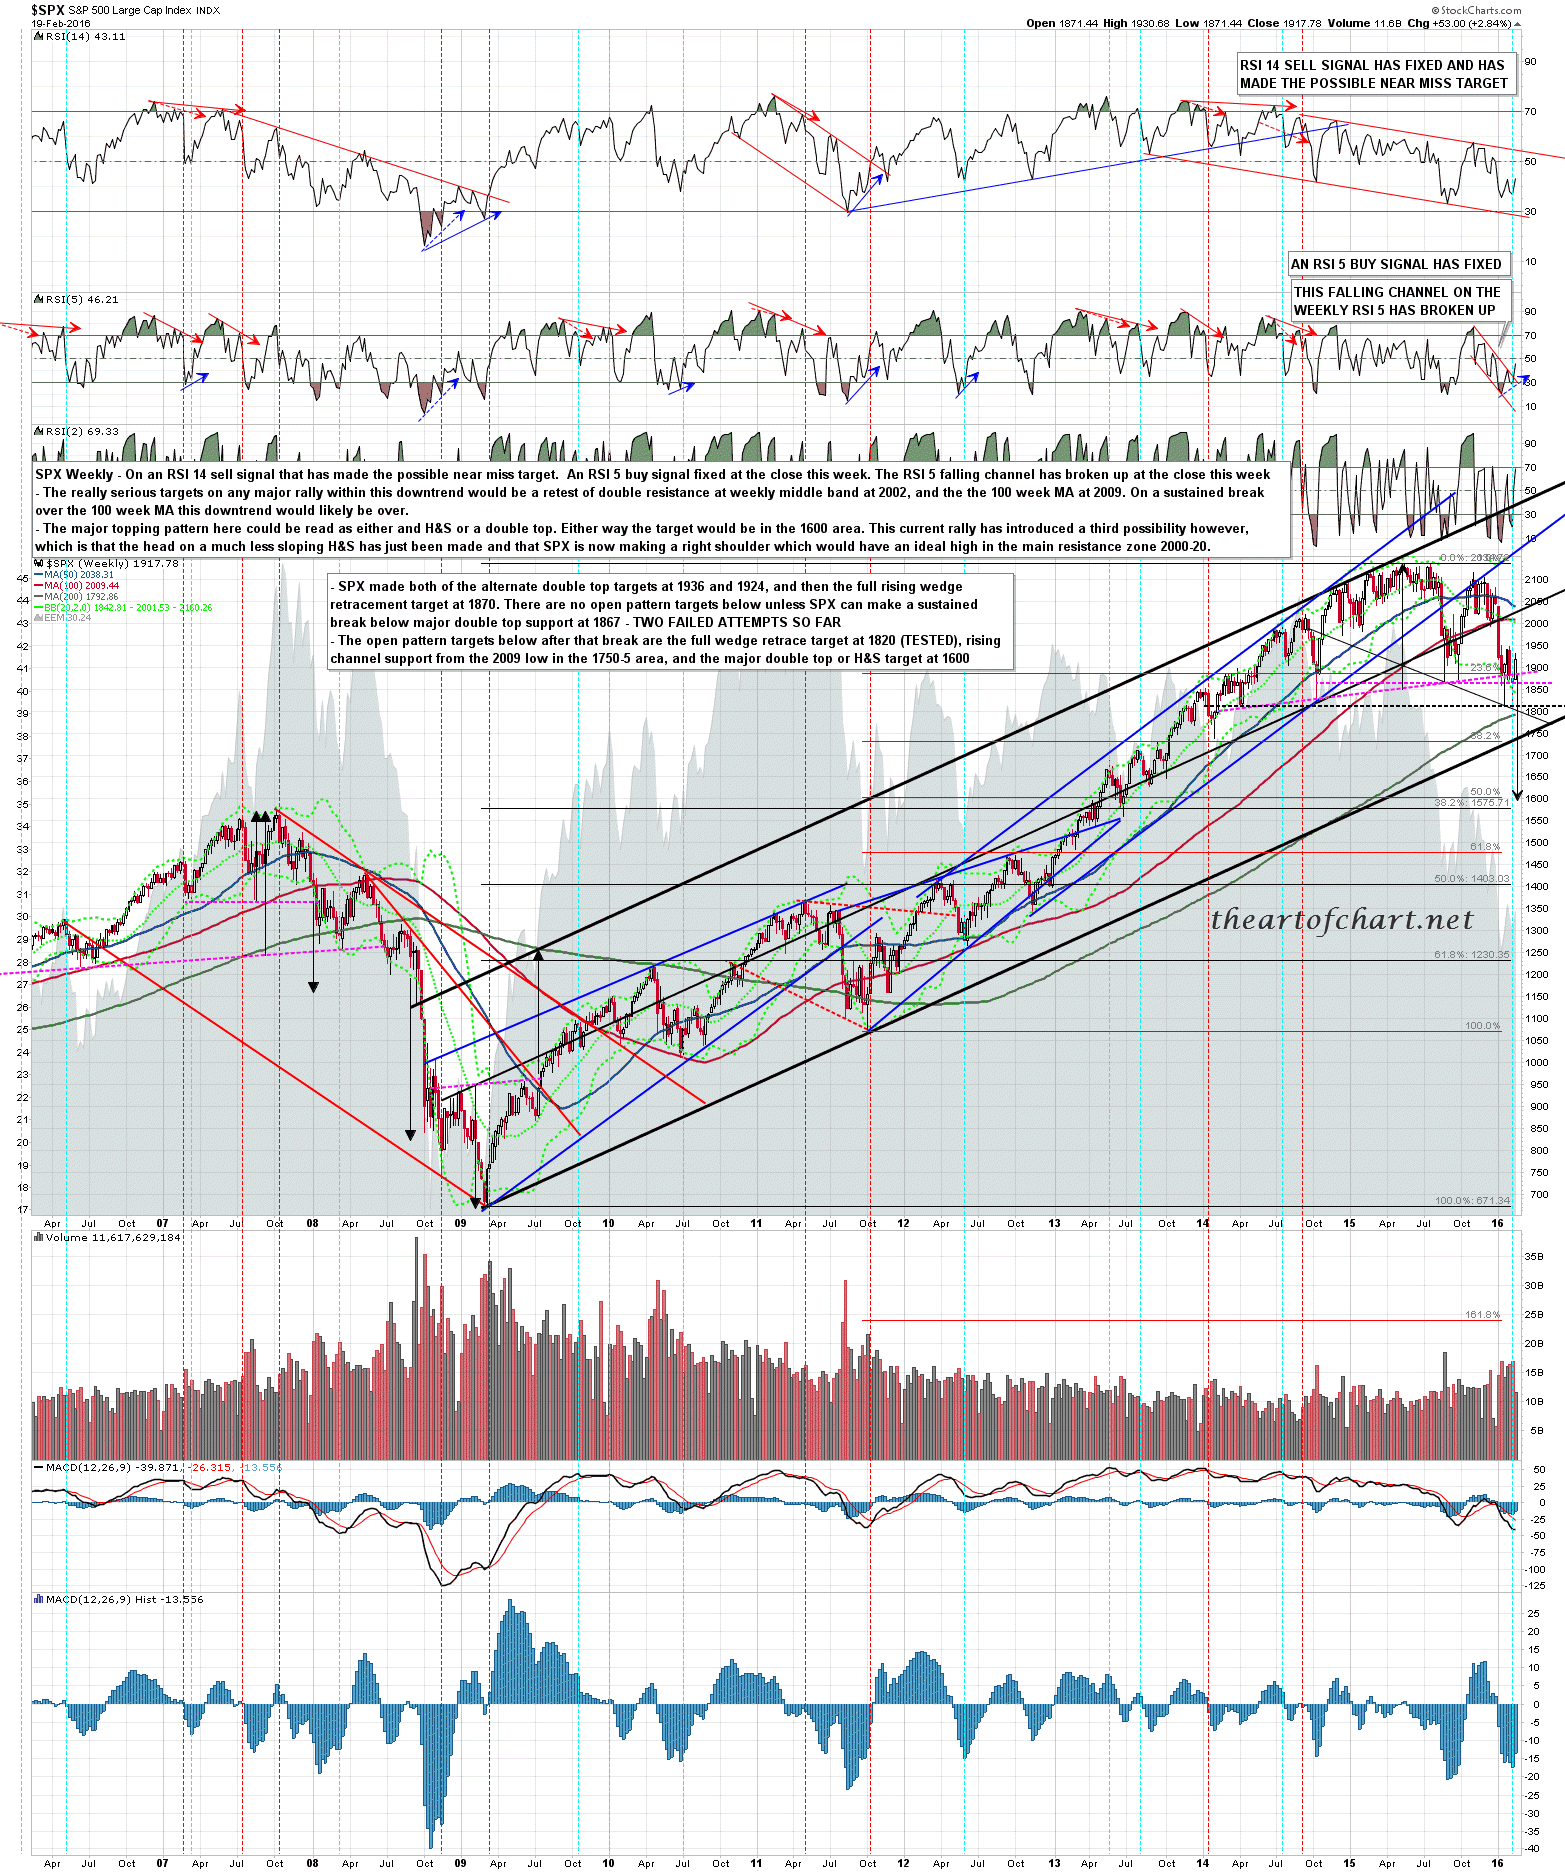
The ideal high would be the 61.8% fib retrace test in the 2000 area. That would be a good match with a retest of the 100 week MA, currently at 2009. A test and fail there would be important bear market confirmation. Equally a test and sustained break there would likely open up a test of the all time high. If we see that test I’m expecting a fail but it’s best to keep an open mind. SPX weekly chart:
Today is a cycle trend day, so there are 70% odds of either bulls or bears dominating trading today. If we are to see a trend day up then I’ll be looking for an AM low, ideally in the 1930-5 area. If we are to see a trend day down then I’ll be looking for an AM high, ideally in the 1945-50 area. I’m leaning long today.
