I didn’t really have time to fall much in love with the possible bull flag channel on SPX yesterday as it broke hard and SPX went directly to the main support level I was expecting to see tested later after a bounce. That level is rising support from the 2022 low in October which I mentioned yesterday morning as being in the 4240 area. The low yesterday was at 4238.63 and that was a solid test and reversal there. The low also established a possible alternate bull flag falling megaphone support trendline from the July high at 4606.097. So where does that leave SPX?
(more…)Slope of Hope Blog Posts
Slope initially began as a blog, so this is where most of the website’s content resides. Here we have tens of thousands of posts dating back over a decade. These are listed in reverse chronological order. Click on any category icon below to see posts tagged with that particular subject, or click on a word in the category cloud on the right side of the screen for more specific choices.
Love And Marriage
I always try and keep an open mind, as too strong a directional view on any trading instrument can result in tunnel vision, where the analyst sees mainly or only the evidence that supports that view. That is an obstacle to good analysis, and for an analyst who trades, can get very expensive. In trading terms it doesn’t matter whether any market goes up or down, as long as the trader is on the right side of the market. Nothing else matters. I can therefore love a market or trading scenario, but no good analyst should ever marry one.
I was talking last week about my preferred scenario on SPX with the H&S looking for the 4050 area, delivering a 50% retracement of the move up from the 2022 low, and potentially setting up another larger move up into a retest of the all time highs on SPX (and NDX). That is not the only scenario in play here however, and the odds of my main alternate scenario happening instead rose significantly yesterday at the swing low that I think was likely made at the low yesterday afternoon, barring retests and marginal lower lows as part of the bottoming process.
(more…)A Modest Proposal
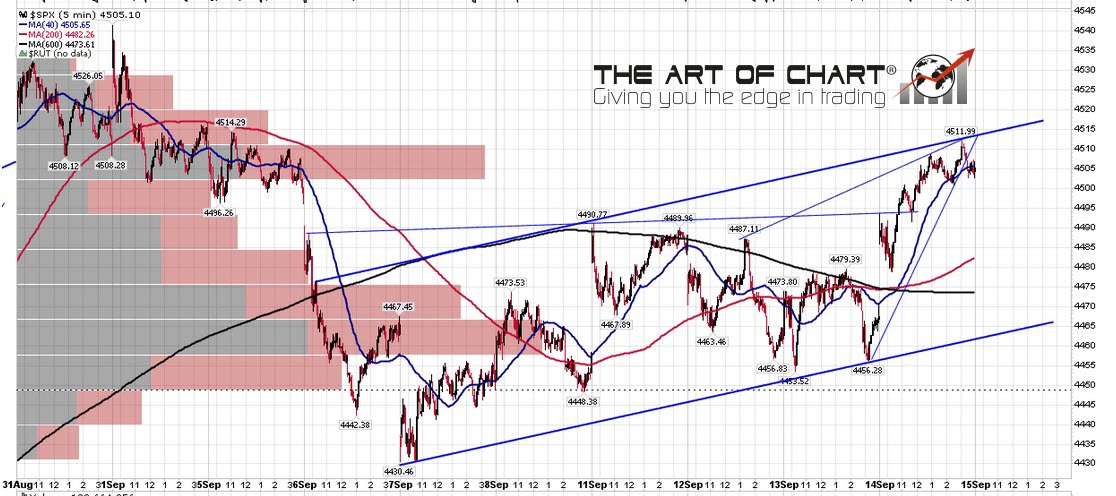
On Thursday night last week I posted a public model trade on my twitter taking a short on ES at 4561.75 looking for the 4350 area. That trade was in thirds, I posted all entries and exits in real time on twitter, and I took the last two thirds at 4399 yesterday for an average gain of 142.5 handles per third. It was a nice trade, and I picked the high area using the SPX 5min chart below on an impressively sweet setup shown below. This move was only a part of the overall scenario here however.
SPX 5min chart (from 14th Sept):
A Festival of Flags
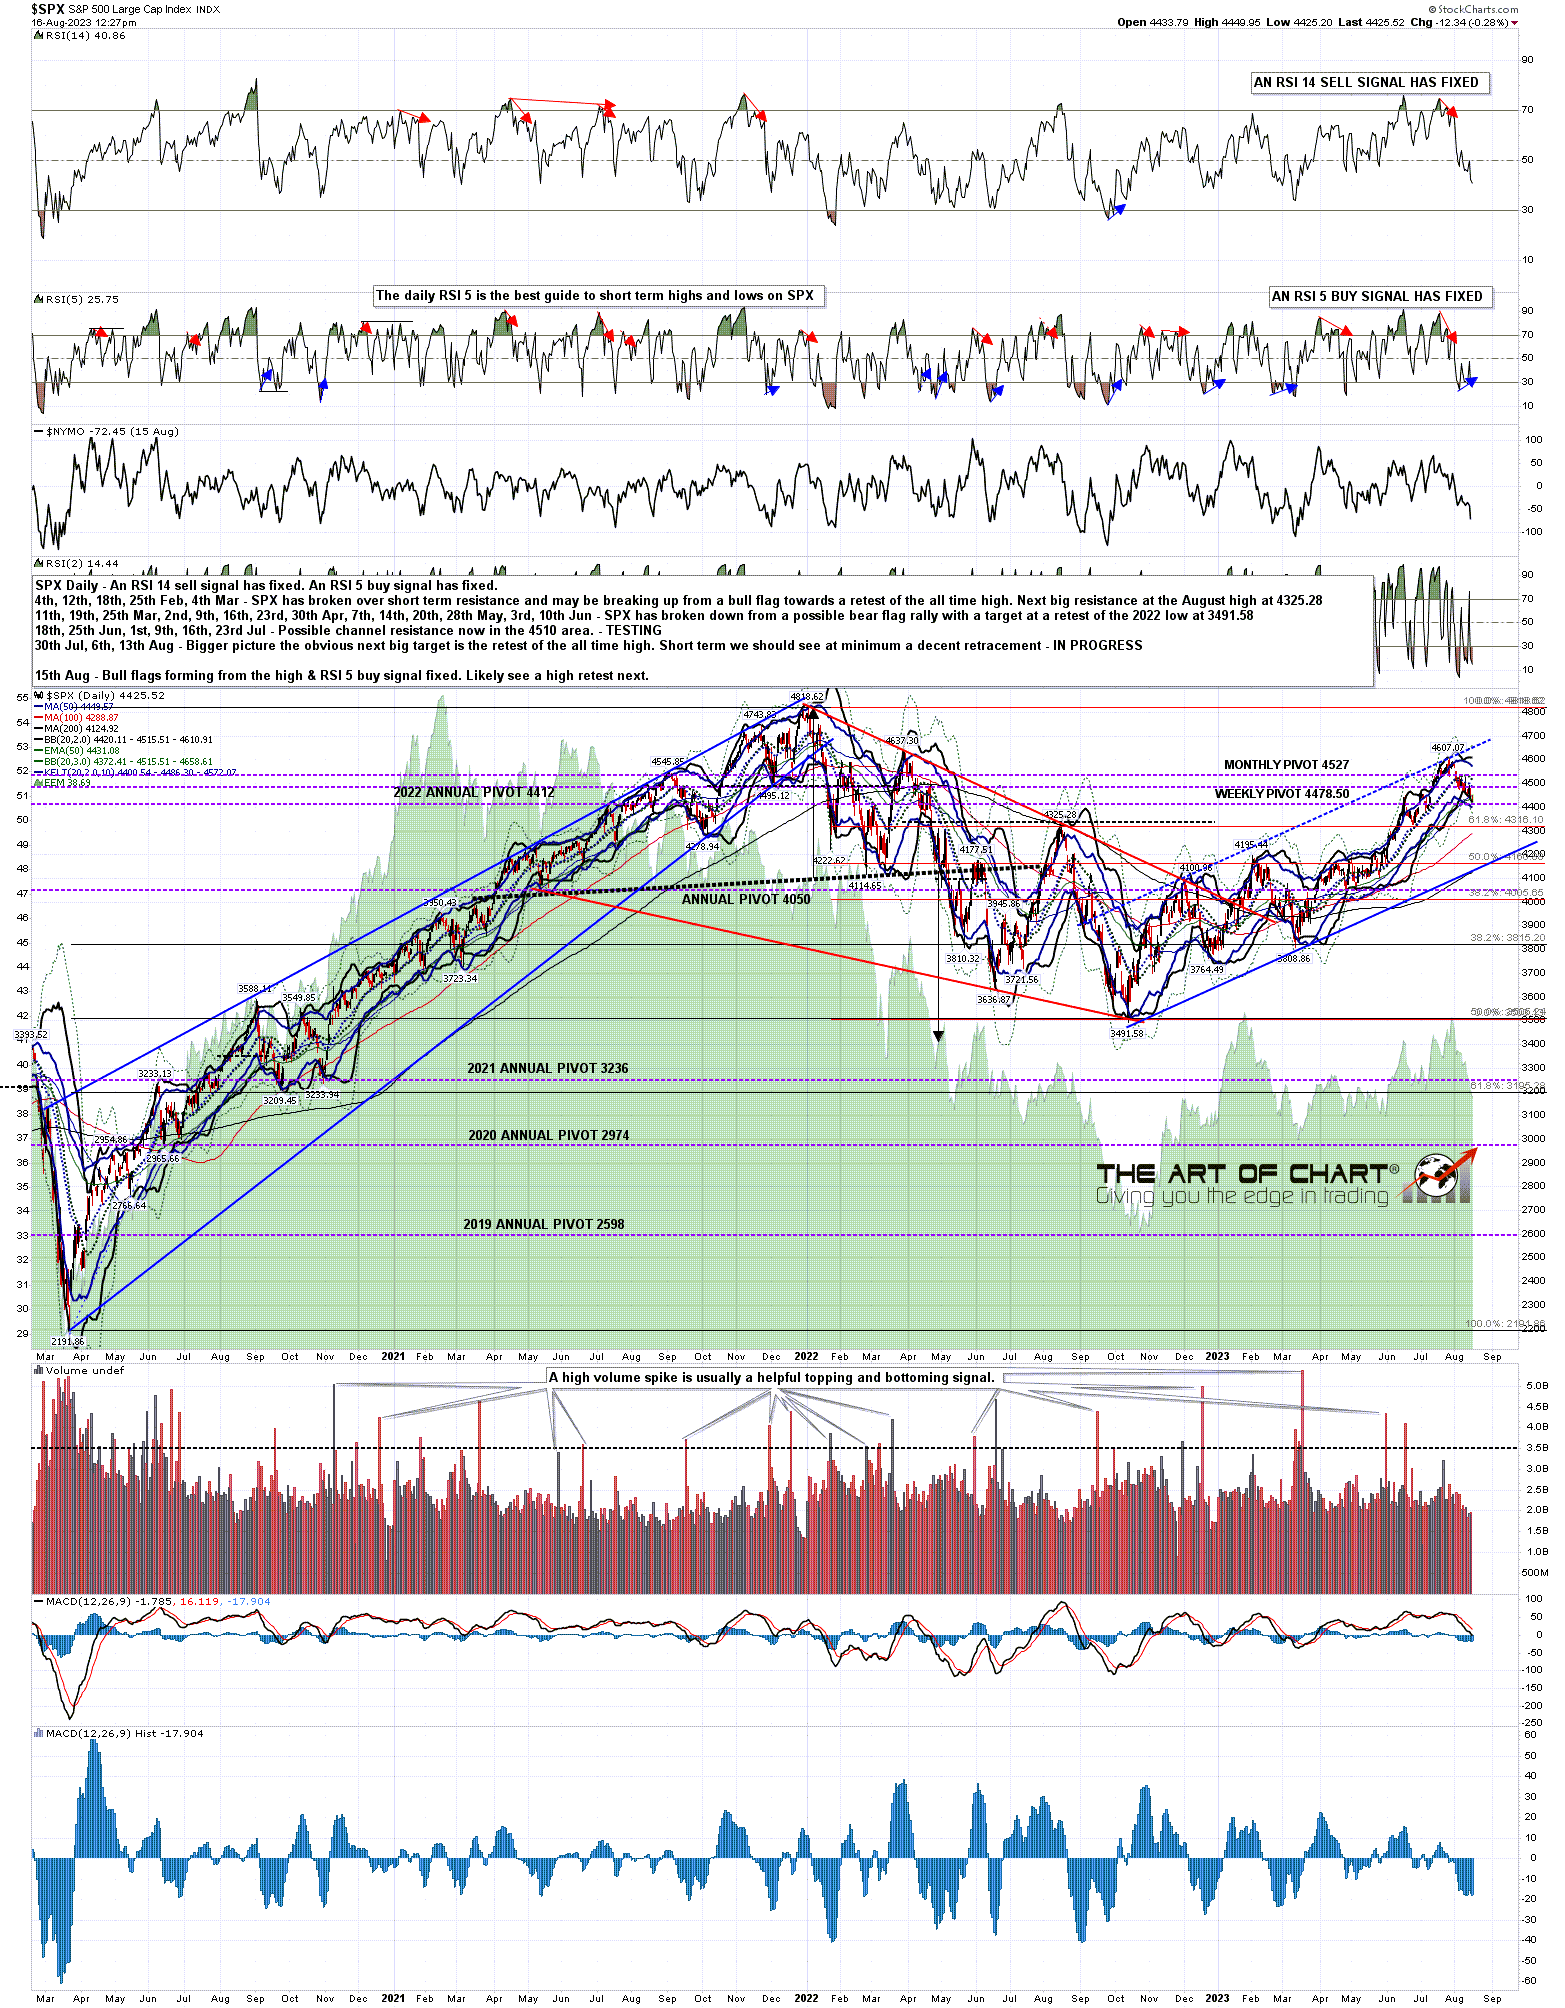
SPX has seen a decent retracement from the highs, the reversion to the mean target at the 45dma has been hit, and a lot of decent looking bull flags have been forming on US indices. SPX may now be close to a retracement low, and a daily RSI 5 buy signal fixed a couple of days ago. The overall setup here is strongly suggesting that the next move on SPX may be a retest of the 2023 high at 4607.07.
SPX daily chart:
So What Next?
Pretty much everything I have written about in my last few posts on SPX delivered. The bull flag wedge from the high broke up. The IHS that then formed broke up and made target, and the bull flag made the target with a retest of the June high.
So what now? Well I was saying that I was expecting a retest of the high to form a topping pattern setting up a larger move down in a reversion to the mean move. The level I use as the mean is the 45dma and that is now at 4287. The last two such moves broke down through it and, if so, I would be wondering about a possible target at the main rising support trendline from last year’s low, currently in the 4090 area.
(more…)