
I always try and keep an open mind, as too strong a directional view on any trading instrument can result in tunnel vision, where the analyst sees mainly or only the evidence that supports that view. That is an obstacle to good analysis, and for an analyst who trades, can get very expensive. In trading terms it doesn’t matter whether any market goes up or down, as long as the trader is on the right side of the market. Nothing else matters. I can therefore love a market or trading scenario, but no good analyst should ever marry one.
I was talking last week about my preferred scenario on SPX with the H&S looking for the 4050 area, delivering a 50% retracement of the move up from the 2022 low, and potentially setting up another larger move up into a retest of the all time highs on SPX (and NDX). That is not the only scenario in play here however, and the odds of my main alternate scenario happening instead rose significantly yesterday at the swing low that I think was likely made at the low yesterday afternoon, barring retests and marginal lower lows as part of the bottoming process.
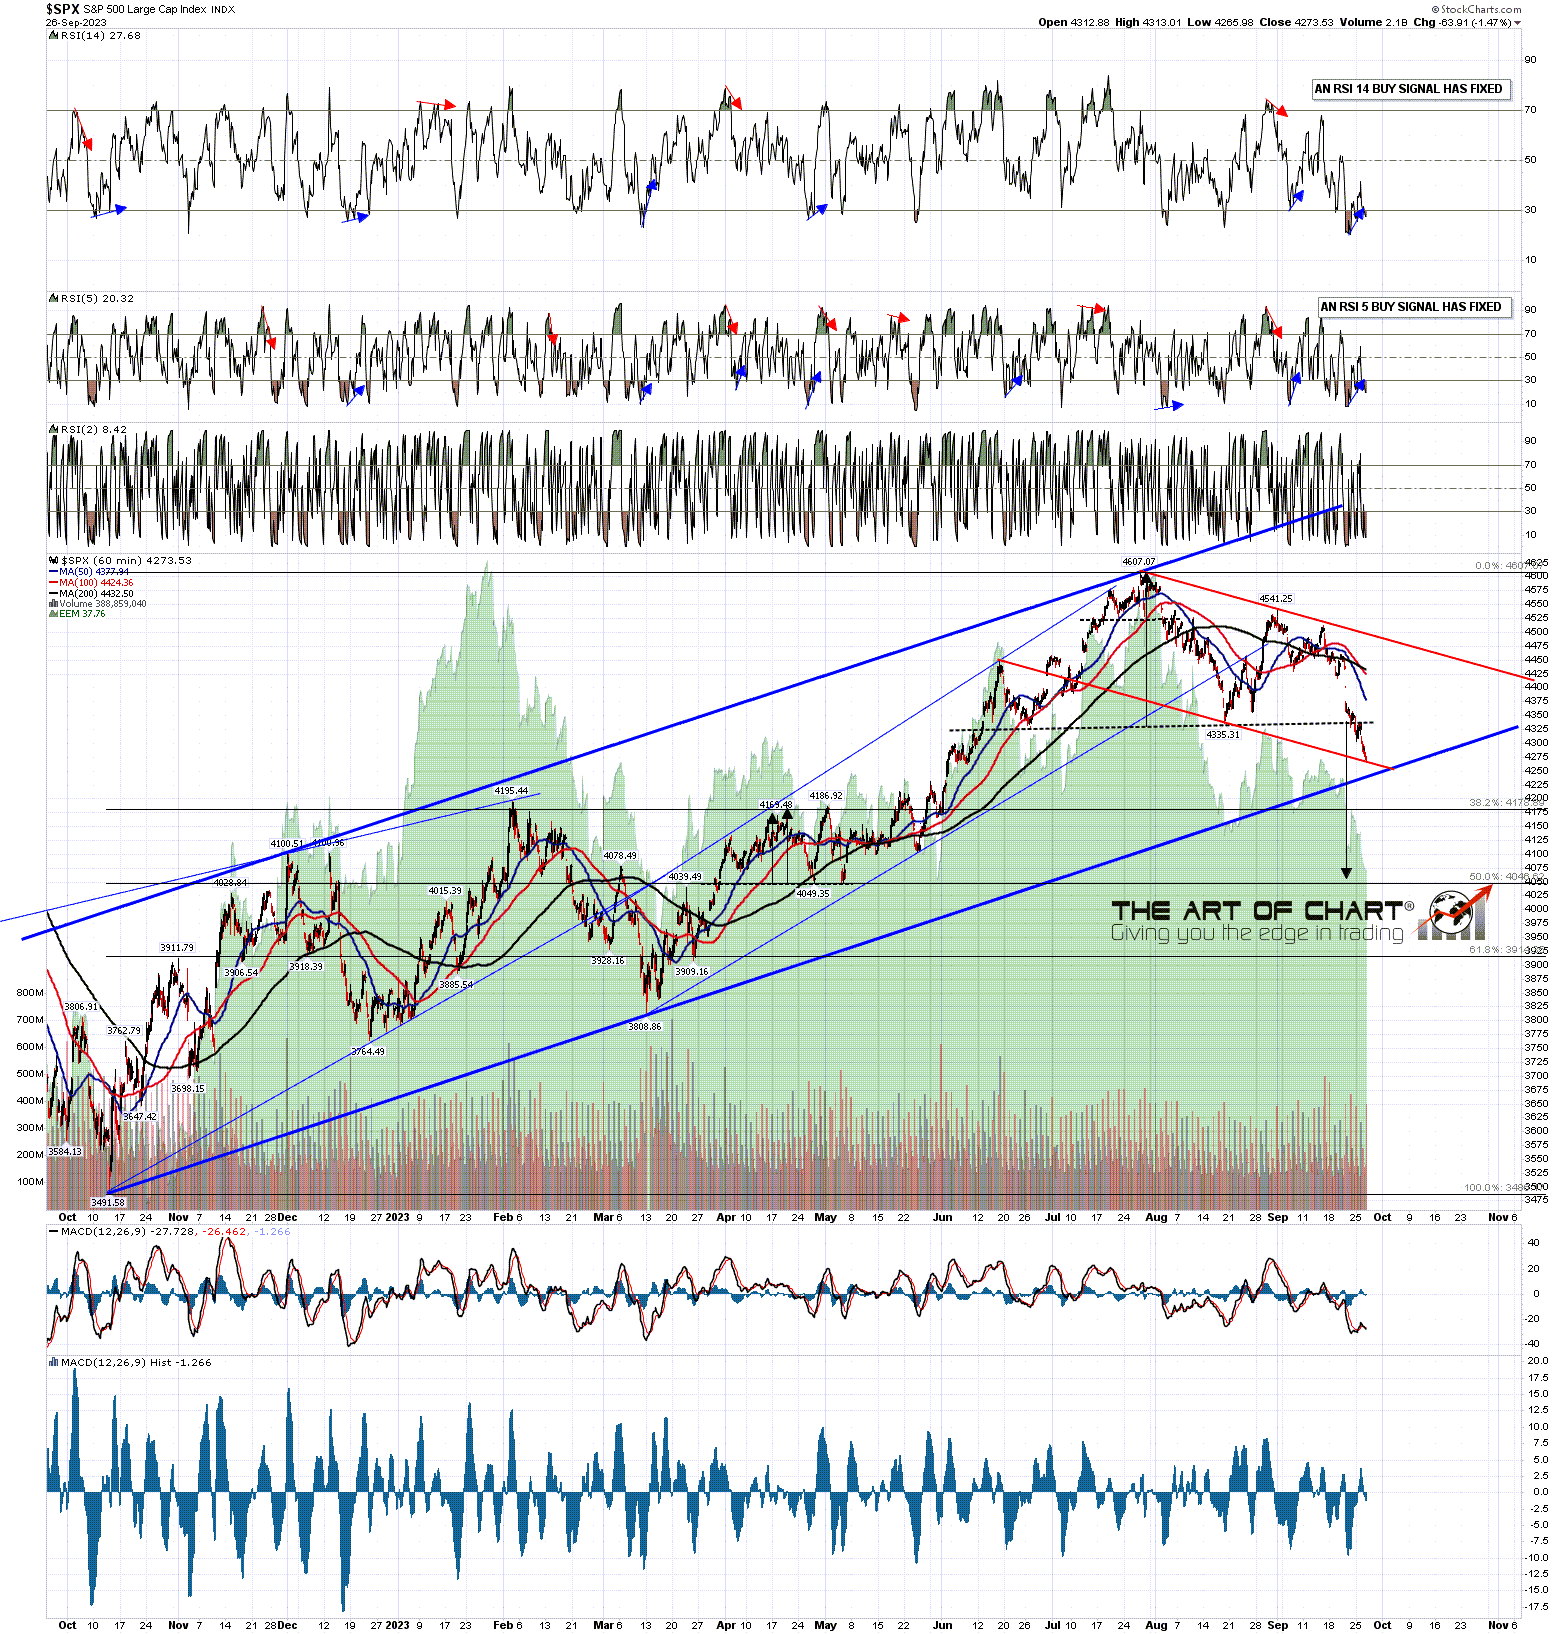
I was expecting to see a rally before SPX made it this far down, but one of the patterns marked on my SPX 15min & 60min charts last week was a falling channel from the late July high at 4607.07. This channel is a possible bull flag channel and the low on SPX yesterday afternoon was a test of that channel support. If that level is this swing low, and barring retests, I think it probably was, then that improves the odds for this bull flag scenario, in which a significant low is being made here on SPX, which would then deliver a move back up to retest the 4607.07 high, potentially setting up a further move to then retest the all time high at 4818.62, where I already have a fixed target from another, larger, bull flag that formed and has broken up from that high.
In the short term I would also note that there is positive divergence almost everywhere on the US indices, which 15min RSI 14 buy signals fixed on all of SPX, NDX, IWM and Dow, and hourly RSI 14 buy signals fixed on SPX and IWM, and brewing on NDX and Dow. It is rare for this level of positive divergence to fail to produce a decent rally.
SPX 60min chart:
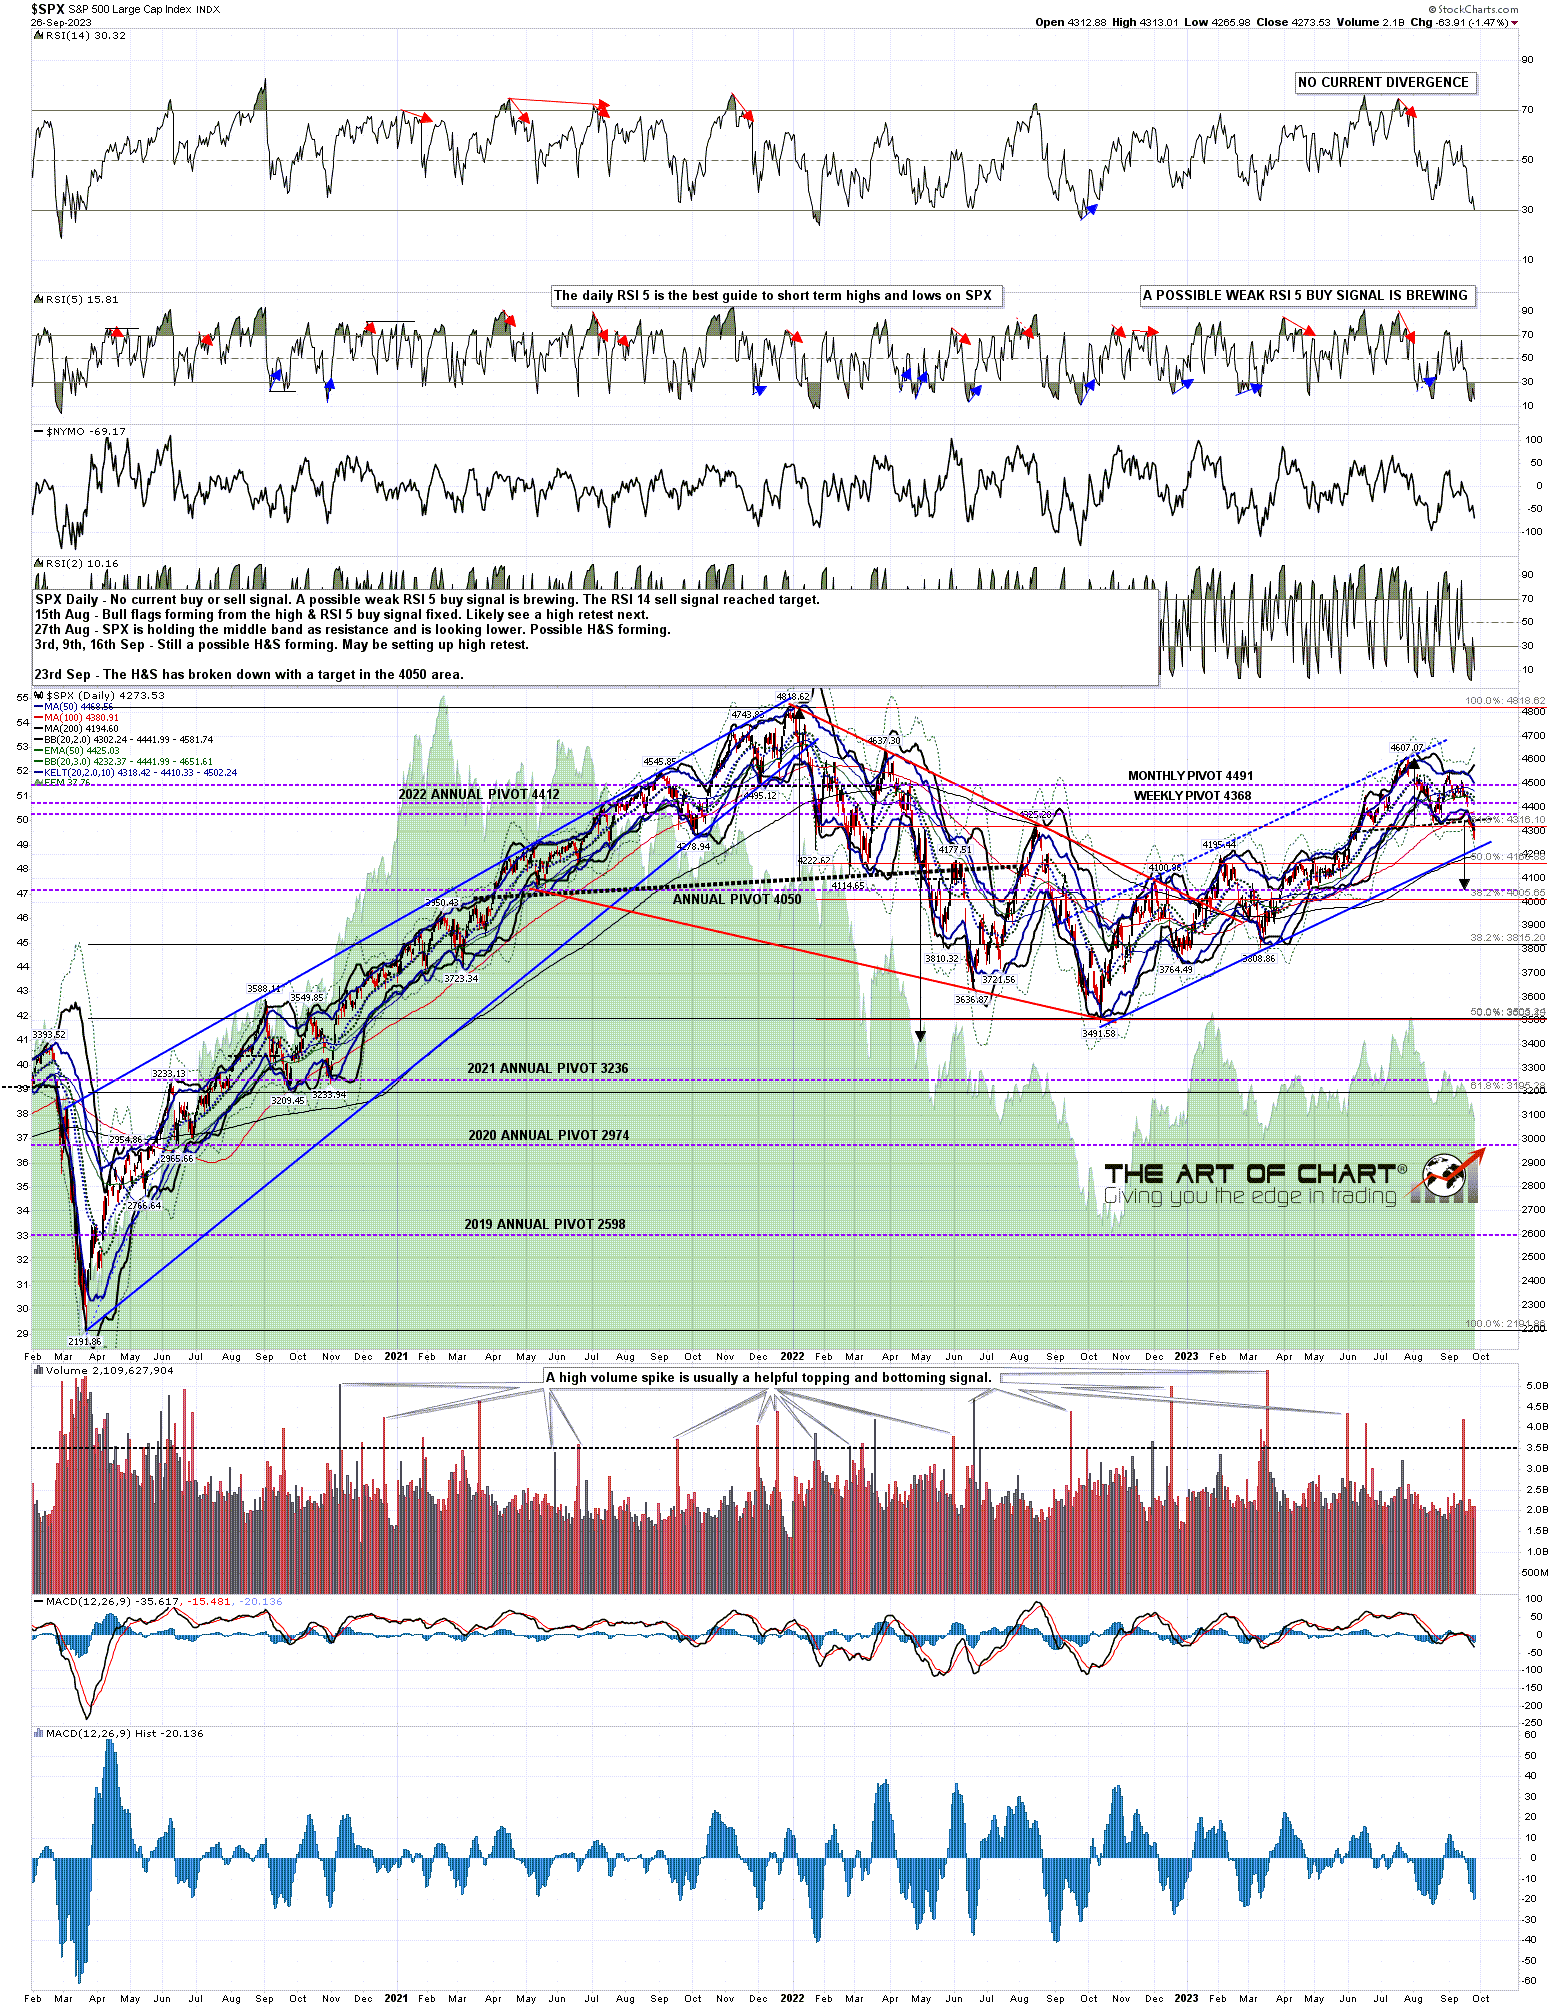
This move down has been so strong that it has even produced positive divergence on daily charts, with daily weak RSI 5 buy signals now brewing on the SPX, NDX and IWM charts. If we see a decent rally and then a low retest, that may evolve into full size daily RSI 5 buy signal divergence on all of the US indices, ideally making that second low within weeks at the main rising channel support trendline from the 2022 low low, currently in the 4240 area, but rising of course.
SPX daily chart:
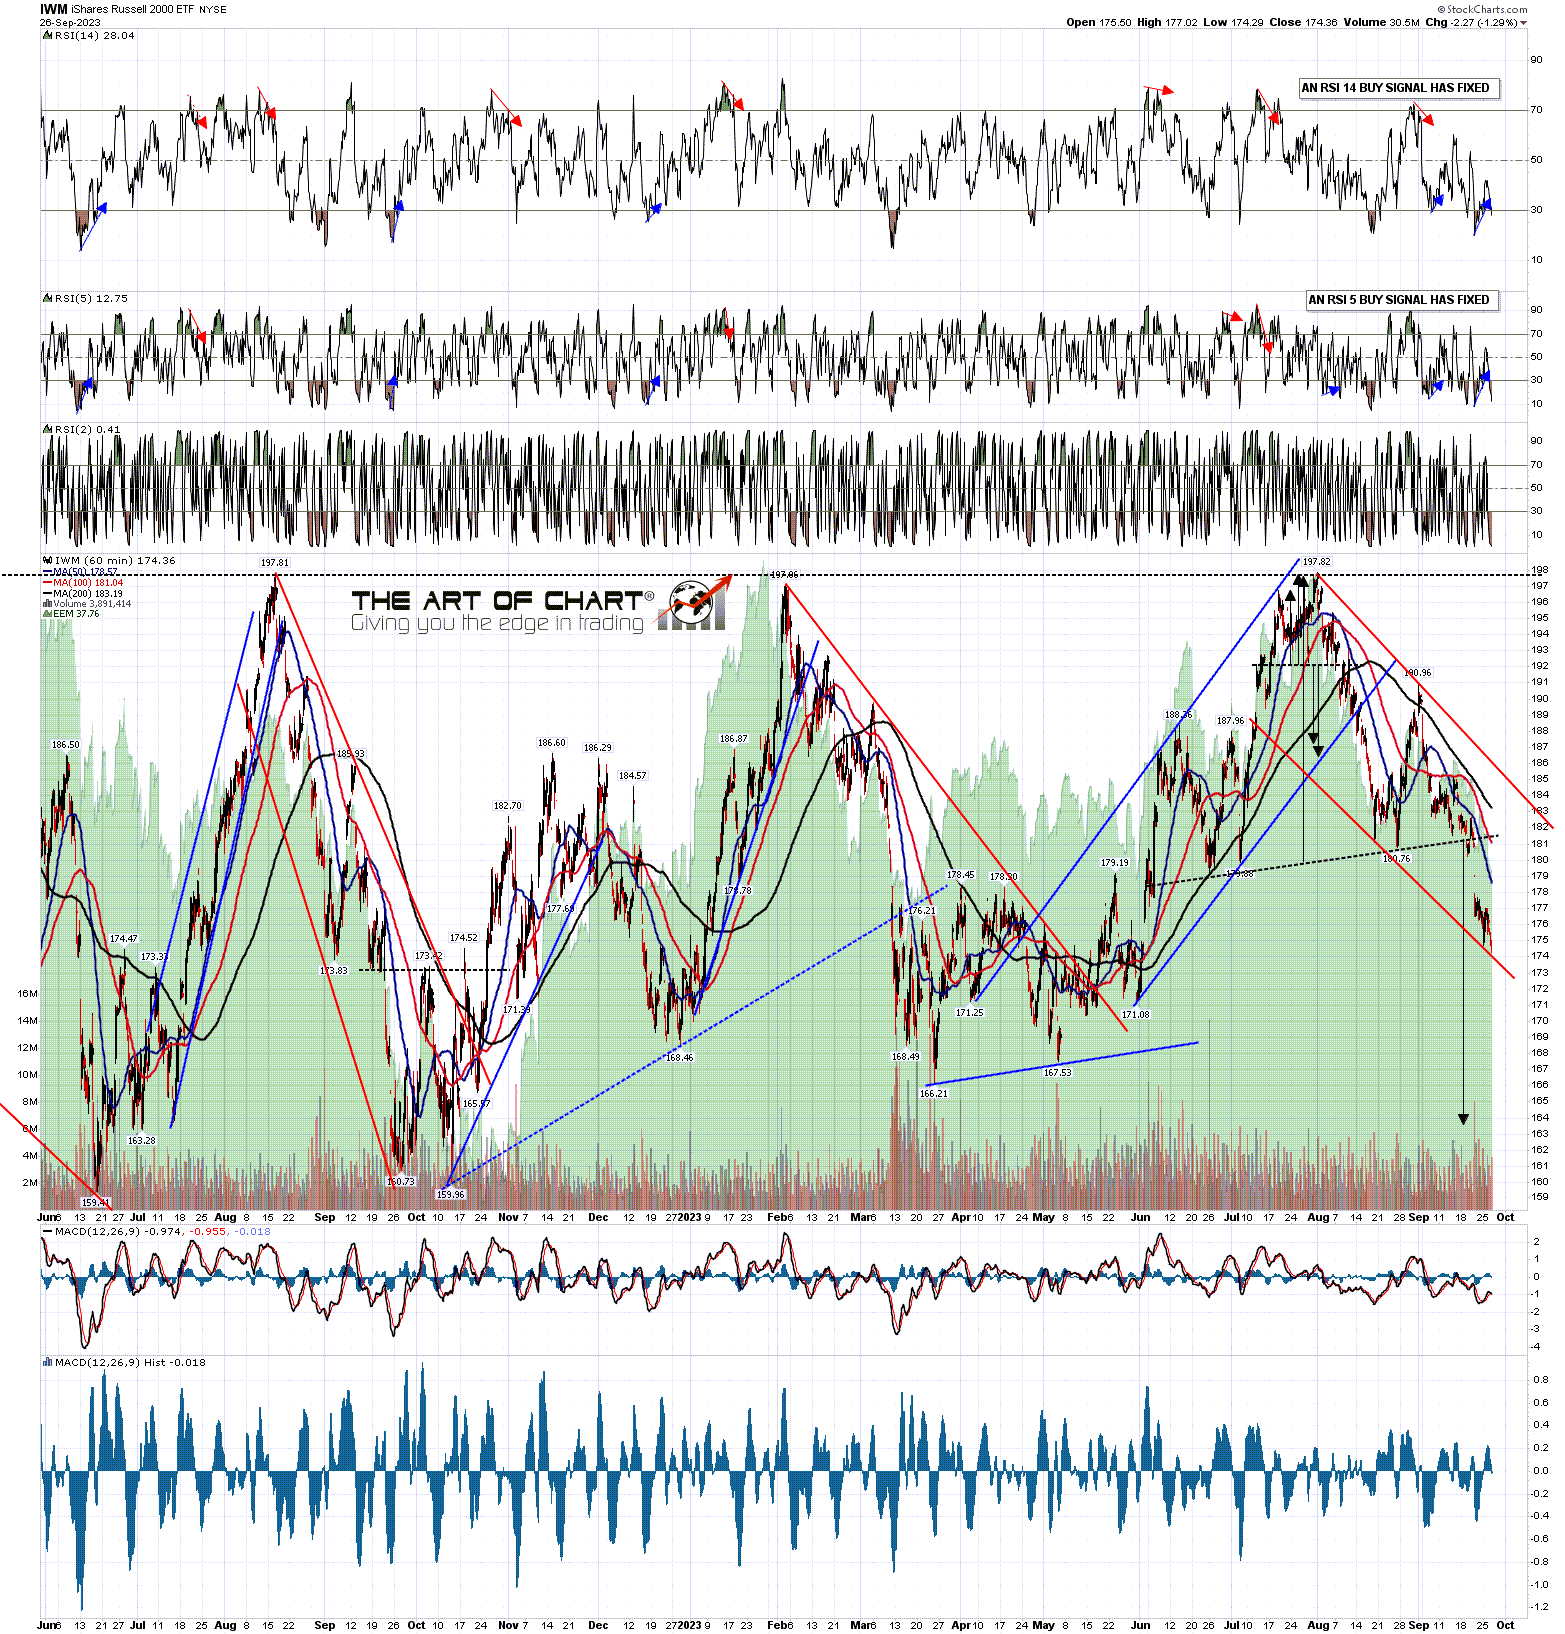
Are there corresponding bull flag candidates on the other US indices? Yes, this one on IWM is another possible bull flag channel, and also hit that channel support at the lows yesterday afternoon.
IWM 60min chart:
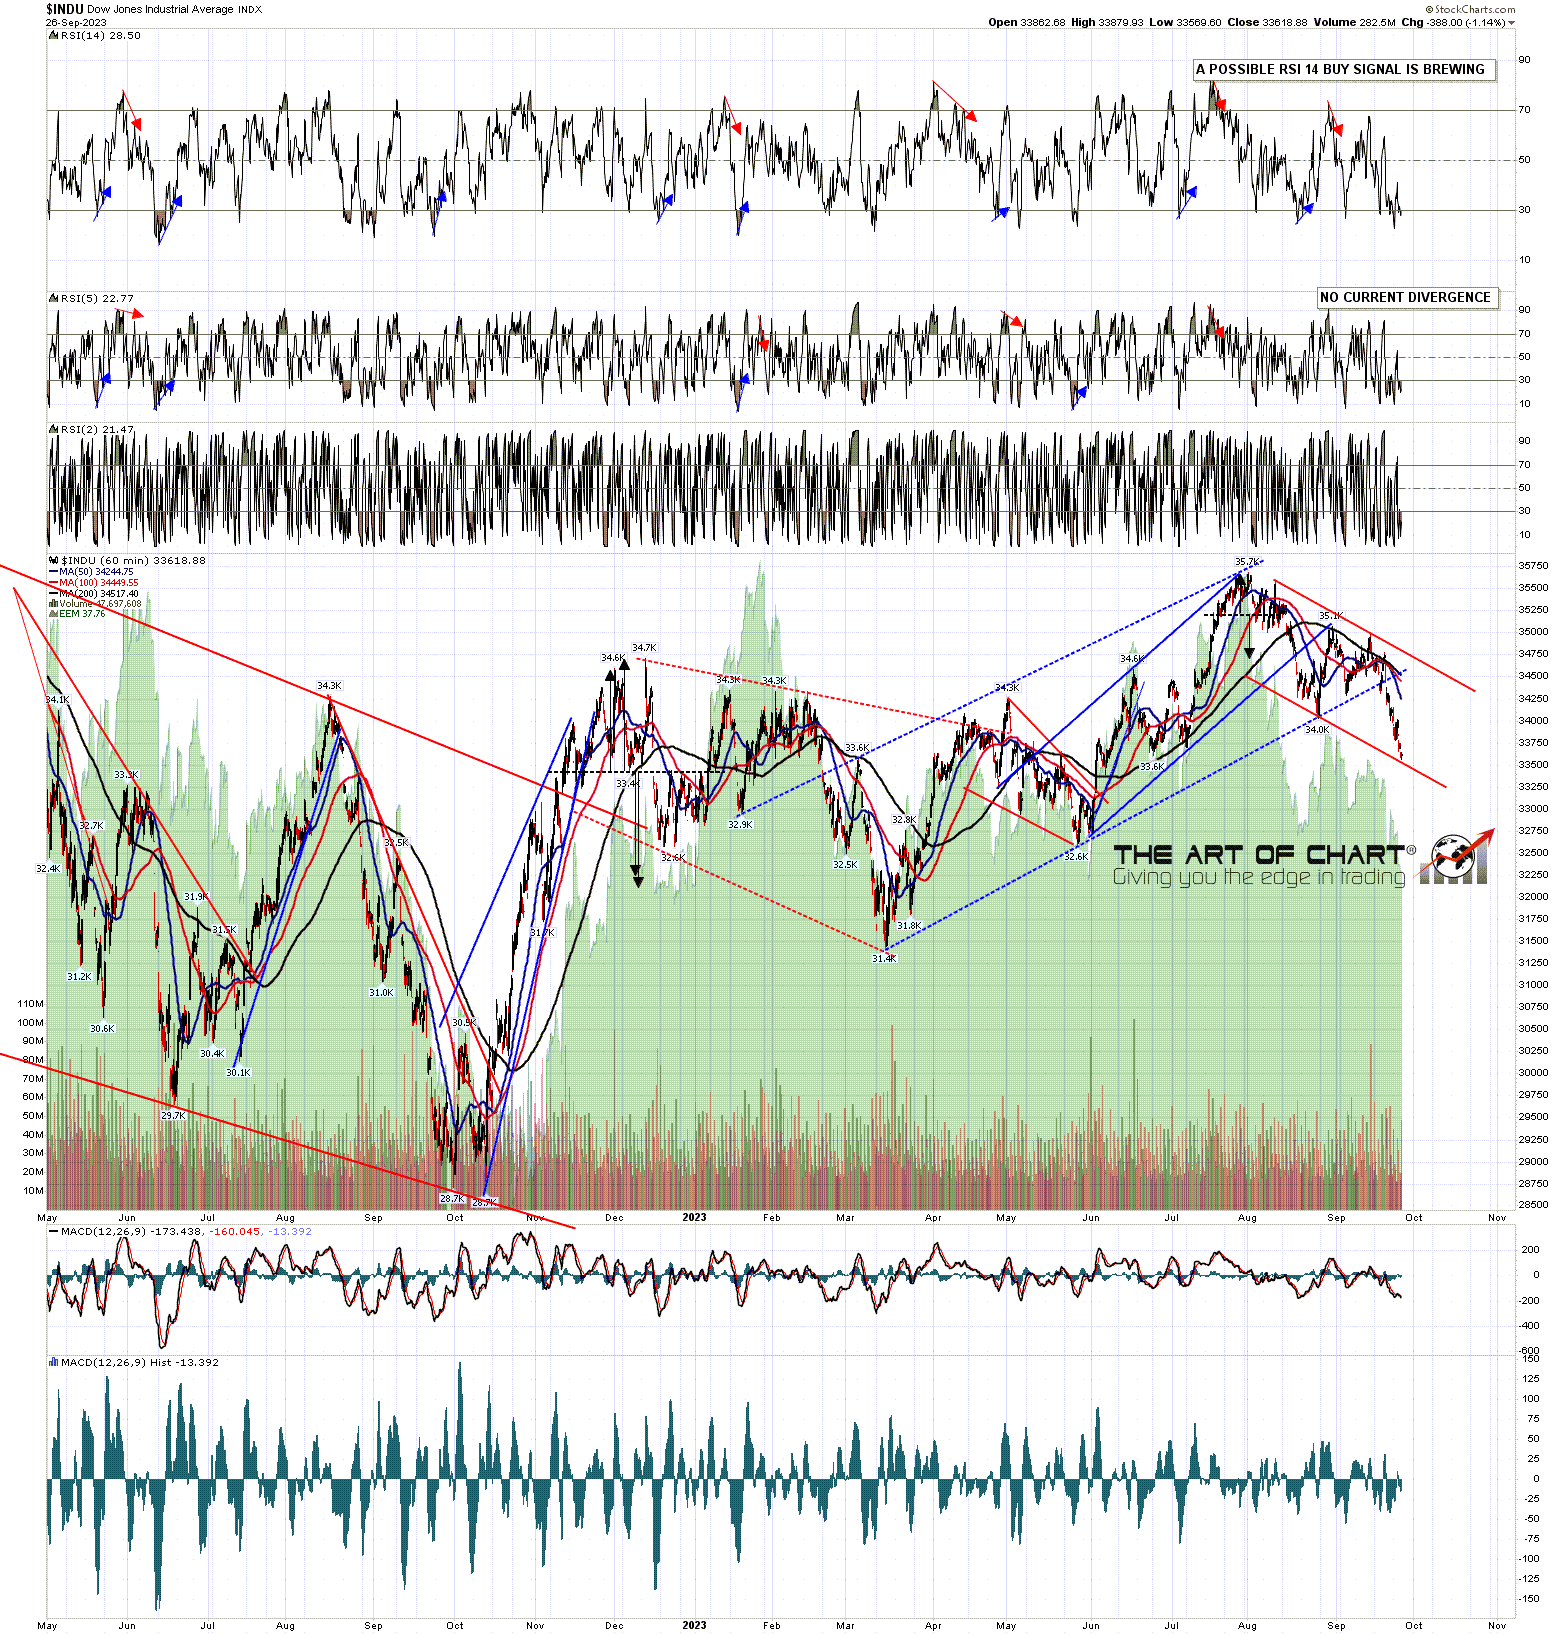
There is a further possible bull flag channel on Dow, with once more that channel support being tested at the lows yesterday afternoon. As a group these three matching bull flag channel setups make a compelling case both for a strong rally short term, and that significant lows may be being made here.
There is also a bull flag candidate on NDX, though that one would be a bull flag falling wedge. Did we hit the support trendline on that yesterday? Well the trendlines there aren’t as clear, as a falling channel has parallel trendlines and wedges do not, but yes, a high quality candidate flag support trendline was hit there on NDX too. That chart not shown today as I try to keep these posts to a maximum of five charts where possible.
Now all these support trendlines may break later of course, and as channels do not under or overthrow to signal a break in the other direction that would damage the bull flag scenario here very badly, but the odds of a swing low here are nonetheless high, and given all these ideal trendline hits, the overall bull flag scenario here became a lot more likely at the lows yesterday.
INDU 60min chart:
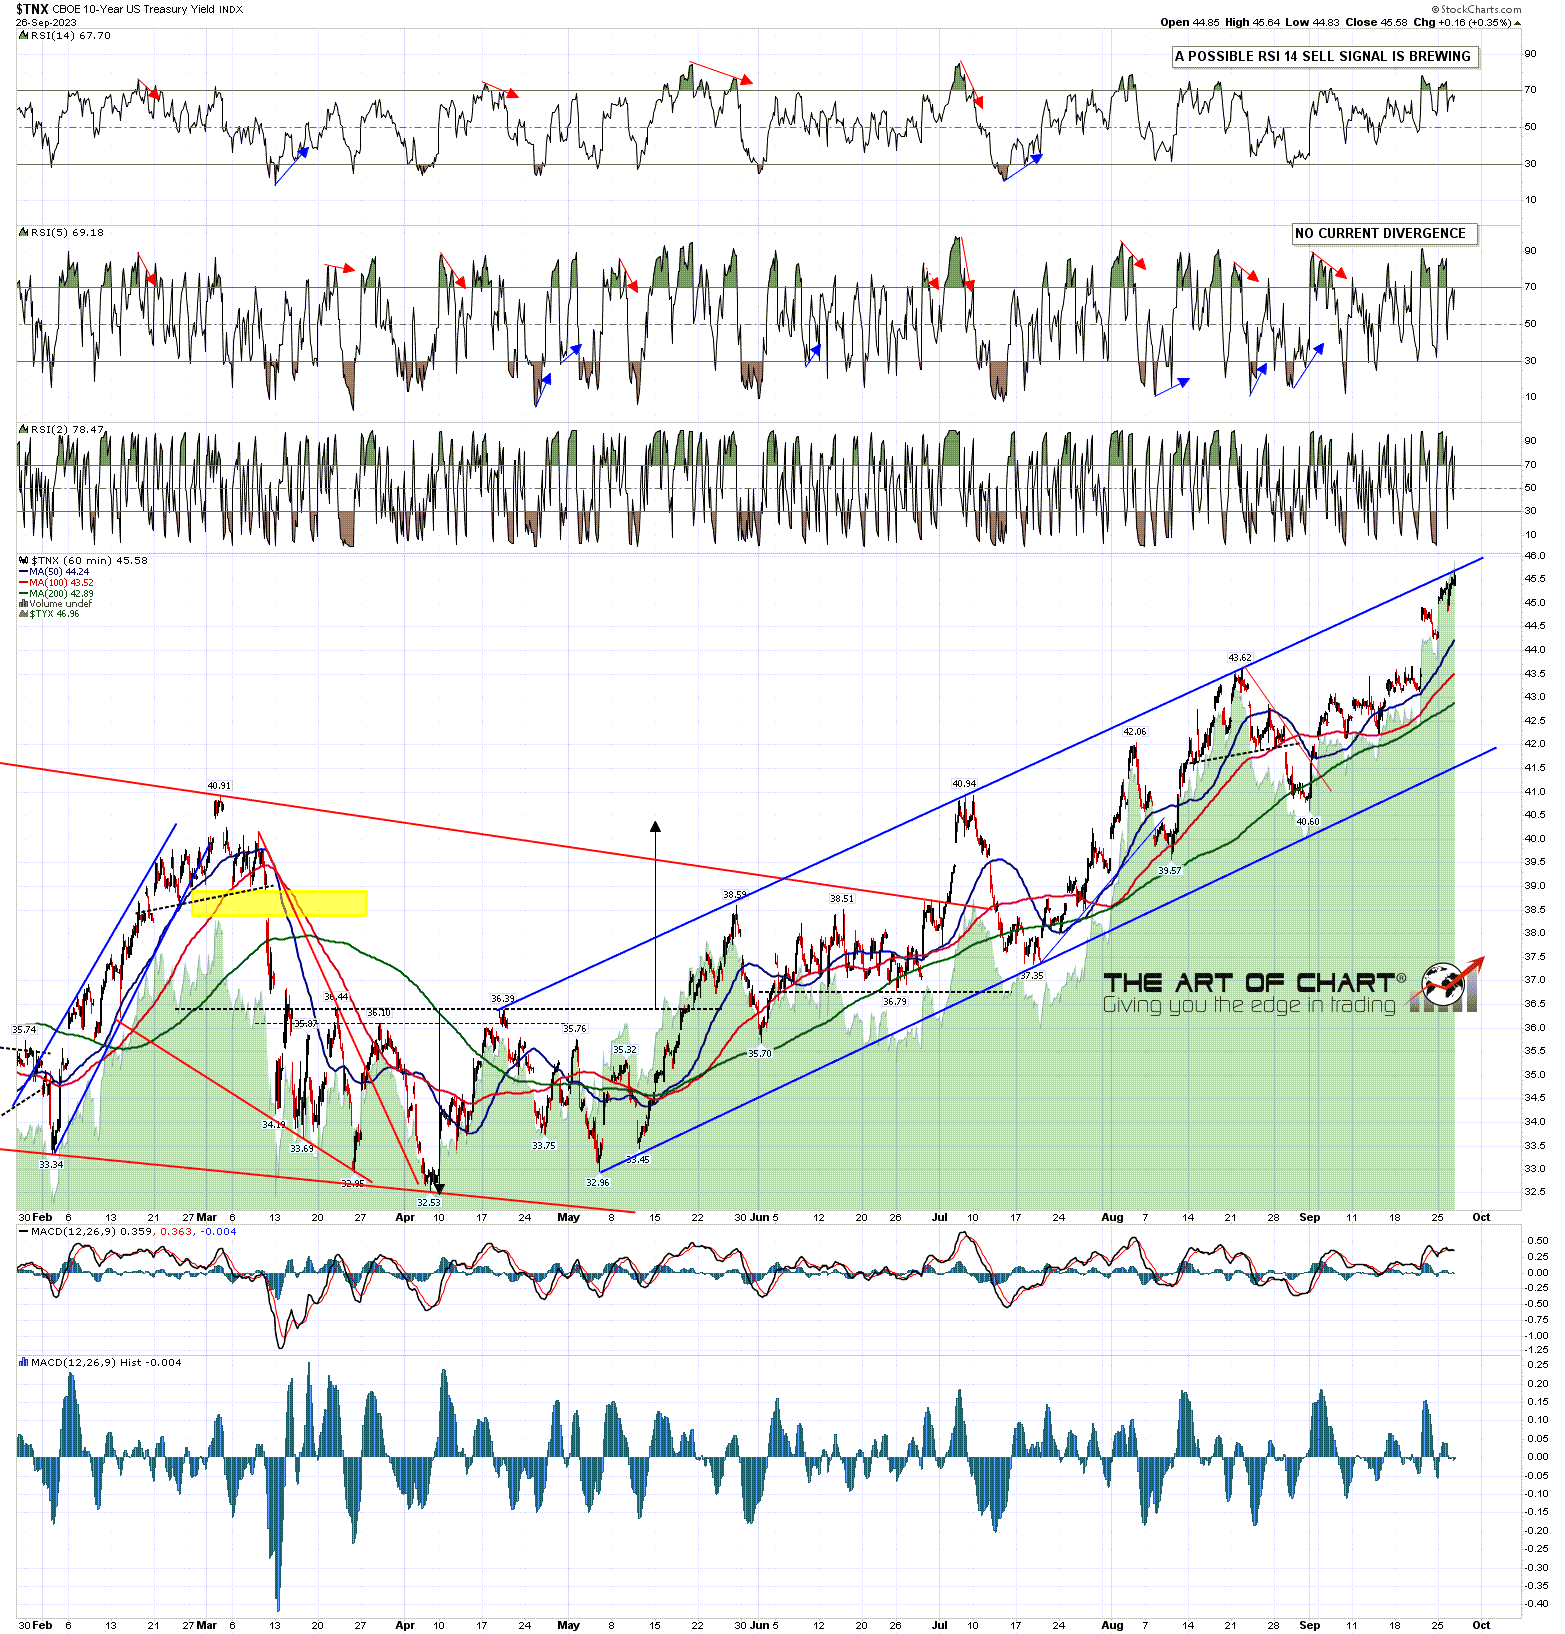
Is there anything else here that would support this bull flag scenario on indices? Yes. Bonds and equities have been moving down together given the current economic situation, and I really like the setup for at least a decent rally on bonds, and possibly a very significant low. I’ll just show you the shorter term term setup on the TNX hourly chart but you can see that the high yesterday was at channel resistance on strong hourly RSI 14 negative divergence. TNX (10yr bond yields) is inverse to bonds of course, but this short term high setup on TNX is in effect a short term low setup on bonds.
I have been talking for weeks at theartofchart.net about a possible very significant low forming here on bonds and the setup for that here is very nice. If that is starting now then that too would support this bull flag scenario on US equity indices.
TNX 60min chart:
What’s the takeaway here? Until the bull flag channel setups here break down I am now seeing the overall bull flag setup here as equally probable to the downside scenario I laid out last week. I’m looking for a strong rally here of at least 100 handles on SPX that may deliver 170 handles or so if a significant low is being made here. The odds or a retest of this low after this rally are decent and, if seen, that may make the second low of a large double bottom that could start a bullish move to take SPX back to the retest of the all time highs.
If seen this scenario wouldn’t be as fun or profitable (for futures traders) as the more bearish H&S scenario that I laid out last week, but would still be both and interesting to trade. As with any futures trader I prefer the Vix high for the big moves that delivers, but any extended trending move has decent short term trades. They’re just smaller in a bull move. We’ll see how it goes but either way it should be interesting. 🙂
I may be starting another model trade for this scenario, but that would probably be at the retest of this low after the rally that is likely starting here.
If you are enjoying my analysis and would like to see it every day (including a daily premarket video) at theartofchart.net, which I co-founded in 2015, you can register for a 30 day free trial here. It is included in the Daily Video Service, which in turn is included in the Triple Play Service.
