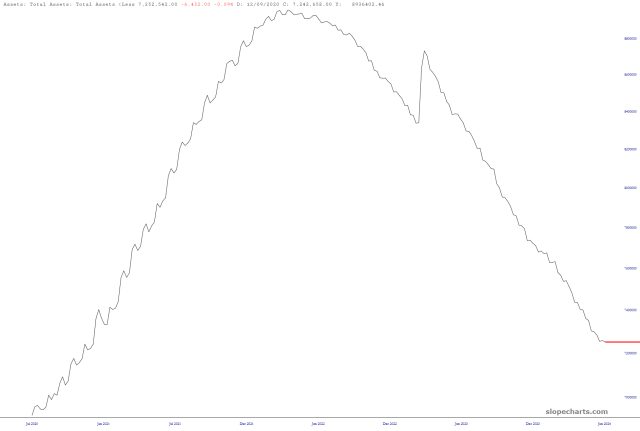
Remember when we all thought that once quantitative tightening would take place, it would take the equity market with it? Good times. Good times.

Remember when we all thought that once quantitative tightening would take place, it would take the equity market with it? Good times. Good times.

Boy, does this bring back a ton of memories!
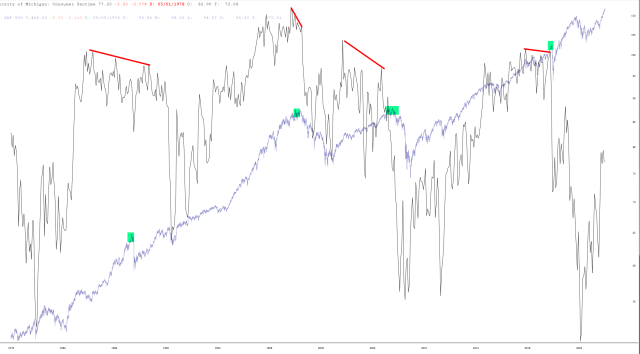
This took a little time to put together but click the chart for a screen-filling version. I have overlaid the S&P 500 with the Michigan Consumer Sentiment Survey. As you can see, major market tops correlated with negative divergences in sentiment. What’s particularly intriguing about this chart is that the plunge in sentiment has been absolutely enormous lately, so I didn’t even bother drawing the insanely-downsloping red line that would be required.

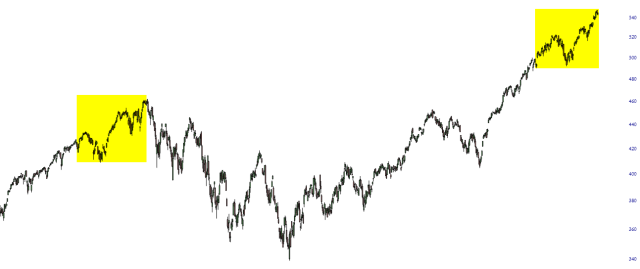
Most analogs offered these days borrow price data from many years, or even decades, ago. I’d like to offer something more recent. I was wondering to myself what the last major dip in the market looked like just before it commenced. I noticed a sizable “stutter” to the market’s ascent in 2021, and I couldn’t help but notice we had exactly the same thing happen in April of this year.
