Slope of Hope Blog Posts
Slope initially began as a blog, so this is where most of the website’s content resides. Here we have tens of thousands of posts dating back over a decade. These are listed in reverse chronological order. Click on any category icon below to see posts tagged with that particular subject, or click on a word in the category cloud on the right side of the screen for more specific choices.
As Awesome as Ever
Can Anyone Explain Autozone to Me???
This is a retail shop that sells spark plugs and fan belts, for God's sake! What's the deal?????
Confused? (by Springheel Jack)
Well ES broke up through the short term declining channel I thought I'd identified yesterday, but there was no matching break up on EURUSD and overnight ES fell very sharply to a low at 1192.75. Looking at ES again I have another candidate short term declining channel that fits well:
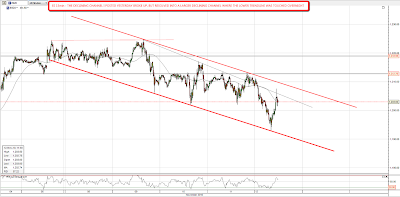
On the bigger picture ES broke the primary support trendline I had from the August low and bottomed at a very well established wedge suport trendline tracing back to 1085. Looking at this chart is possible that this will prove to be the retracement low, with the upper wedge trendline now in the 1238 area and rising:
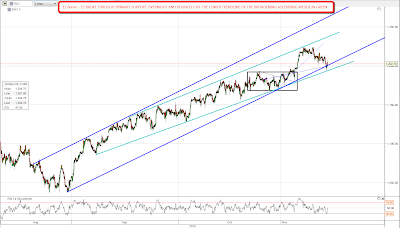
I'm doubtful about the retracement low being in, though if my revised short term declining channel breaks resistance in the 1210 area that will look more likely. I'm doubtful because the EURUSD low is most likely not in, with the obvious target being in the 1.32 area at the support trendline for the broadening ascending wedge:

Short term however, EURUSD may now bounce, with the very steep and narrow declining channel from the recent high having broken up overnight. I've pencilled in a possible wider declining channel that may be forming with a bounce target in the 1.39 area:

So where's SPX going today? Hard to say, but I suspect strongly that the overnight low will hold today as that was a very significant support hit, and was the lowest ES could could go within the currently established broadening ascending wedge. It was also only just above the 20 day SMA. What I would expect though, is that we may well see a retest of that support in trading hours.
Oil and Gas Peak?
Quite a night, eh?
In spite of my noting that ultra-bullish DIG had broken out yesterday, I found an interesting chart that seems to contradict the importance of that breakout – the clumsily-symboled $DJUSEN Dow Jones Oil and Gas index.
There are two reasons to believe this has crested:
(1) It has nailed a major 61.8% Fibonacci retracement level (which is based on lifetime extremes of this index);
(2) It has perfectly met its measured target from the IHS pattern that ranges from May 17th to September 29th of this year
