
While we've been retracing, I and many others have been playing this on the assumption that we are looking at a wave 4 retracement here, and that it would be followed by a wave 5 up after the retracement bottomed. There's a good argument in my view that this wave 4 retracement has bottomed this week, and that the new wave 5 up has started. That wave 5 up on SPX would target at least a new high, but would most likely target somewhere in the 1250 to 1300 area over the next few weeks, with a EURUSD target in the 1.45 to 1.50 area.
There are a number of reasons to think the retracement has bottomed, mainly that the obvious retracement targets in a number of areas have been hit, notably on the USD bounce, XLF and others. One commodity that I watch very carefully is silver, and there I've been watching what looks like a classic retracement low. You can't see all of it on this chart, but silver has retraced to the support trendline from where the cuurrent advance started at just under 18, forming a falling wedge on the decline, with a small IHS in the reversal area that played out to target overnight:
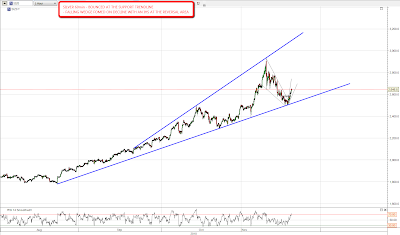
Now silver's important because it is part of the gold:silver ratio indicator, and because it tends to outperform gold on waves up. When silver is in a wave up stocks tend to perform well too, and if silver has bottomed, the chances are that stocks have also bottomed.
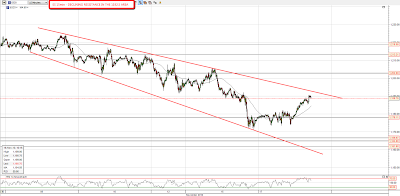
We don't yet have confirmation that stocks have bottomed yet of course, but we may well get that today, as NQ and ES are both nearing a test of their declining resistance trendlines. On the Nasdaq futures (NQ) I'm seeing declining resistance in the 2130 area. A touch there is a perfect short entry of course, as it is declining resistance on a declining pattern, and the risk/reward for a short entry there is therefore excellent with a stop slightly above the trendline. On a break of that trendline however it becomes an excellent long entry for the further upside that should follow that break:
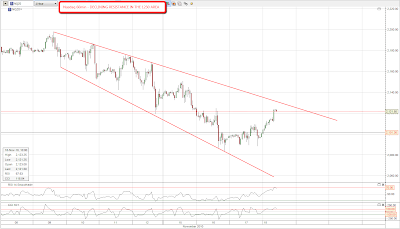
Encouragingly for the long side here, declining resistance on the broadening descending wedge on the corresponding Nasdaq chart is at 2110, and that has already been convincingly broken in overnight trading, though we could pull back within it before the open of course:
On ES I'm seeing declining resistance in the 1192.5 area, and again that is a nice short entry with a tight stop in case the retracement has further to go:
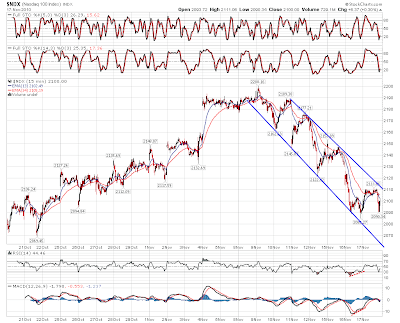
Unlike on Nasdaq, the ES and SPX charts match up almost exactly, and declining resistance on SPX is in the 1195 area:

I'm leaning towards a break up here, and while I share the bears' feelings that this bull market is more bull than market, I don't think the Fed's credit cards are maxed out yet, and until they are, this bull market is likely to continue. If we get a nice wave 5 up here, then we should reach a level within a few weeks where there are some unambiguously excellent short entries for what should then be a very decent pullback. Bears should be patient, and if we do break up, then we should all just settle in and enjoy the ride.
