
Every so often we reach an inflection point on SPX where short term direction is particularly hard to call, and when that happens I looks across the main US indices to see what they can tell us. In honor of a particularly brutal drinking game I sometimes played at university I call this an optic run. Today I’m going to post a full optic run review to try and see where SPX is going next.
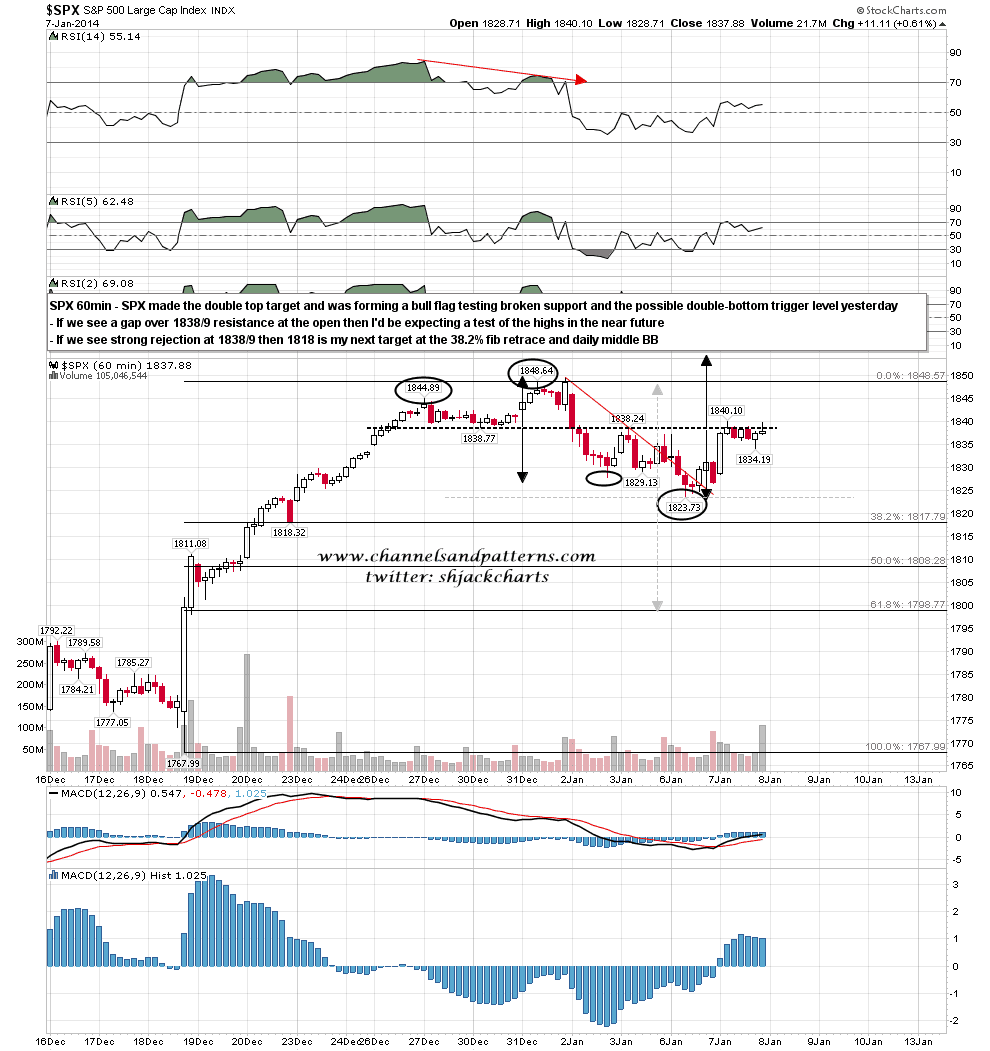
First SPX where the double-top target was made, and a possible double-bottom has formed targeting at least a test of the current highs on a break back above broken support at 1838/9. SPX formed a bull flag at that resistance yesterday. If we see a gap over resistance this morning then the next obvious target is that retest of the highs. if there is a strong rejection at 1838/9, which looks possible at the time of writing, then my next downside target is 1818. SPX 60min chart:
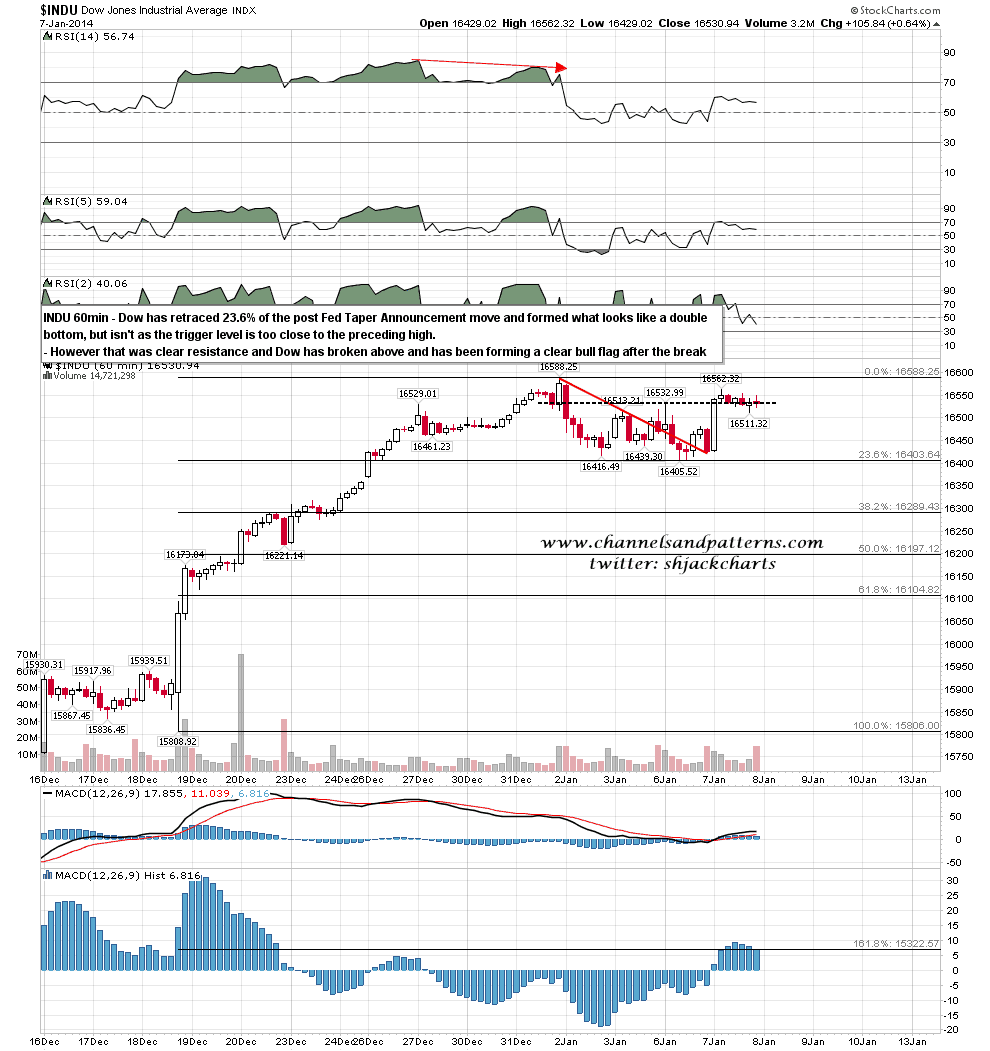
Dow didn’t really have a topping pattern, and there isn’t a viable bottoming pattern either, though there was a double-tap reversal trendline from high to low. Dow broke over clear resistance yesterday and has been forming a bull flag just above it. I’m leaning long on Dow. Dow 60min chart:
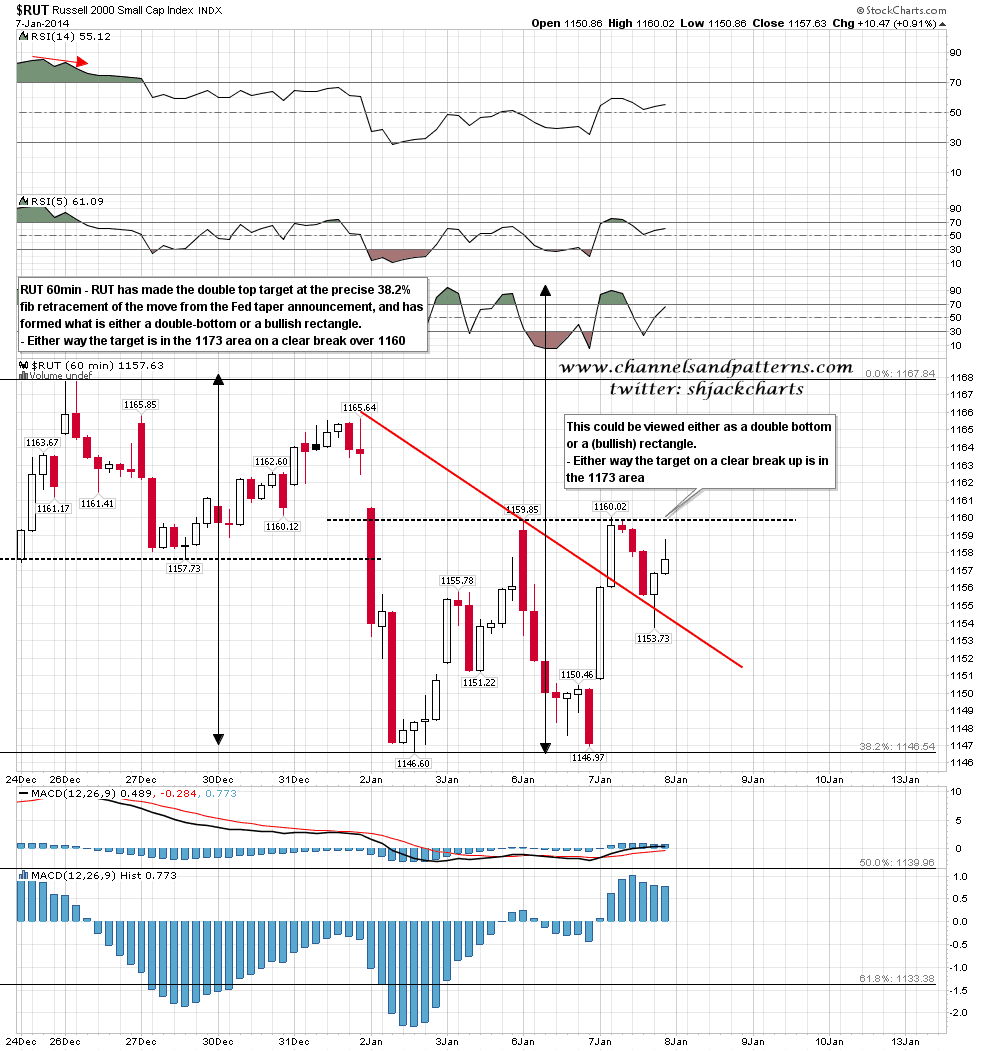
RUT made the double top target there and has formed what is either a possible double bottom or a bullish rectangle. on a clear break over 1160 resistance the targets for either would be 1173, and I’d be expecting to see new highs. RUT 60min chart:
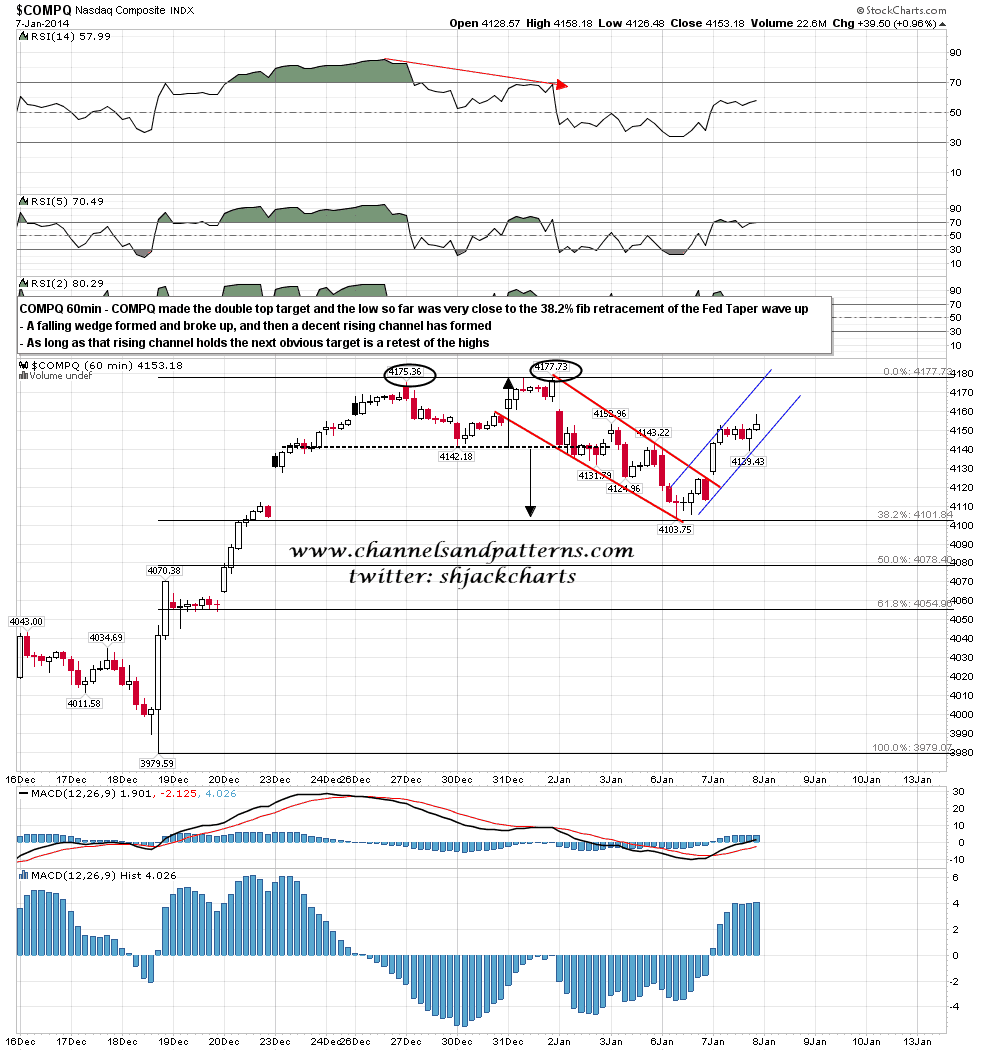
COMPQ made the double-top target there in a falling wedge which has broken up into a rising channel. As long as that channel holds that looks bullish. COMPQ 60min chart:
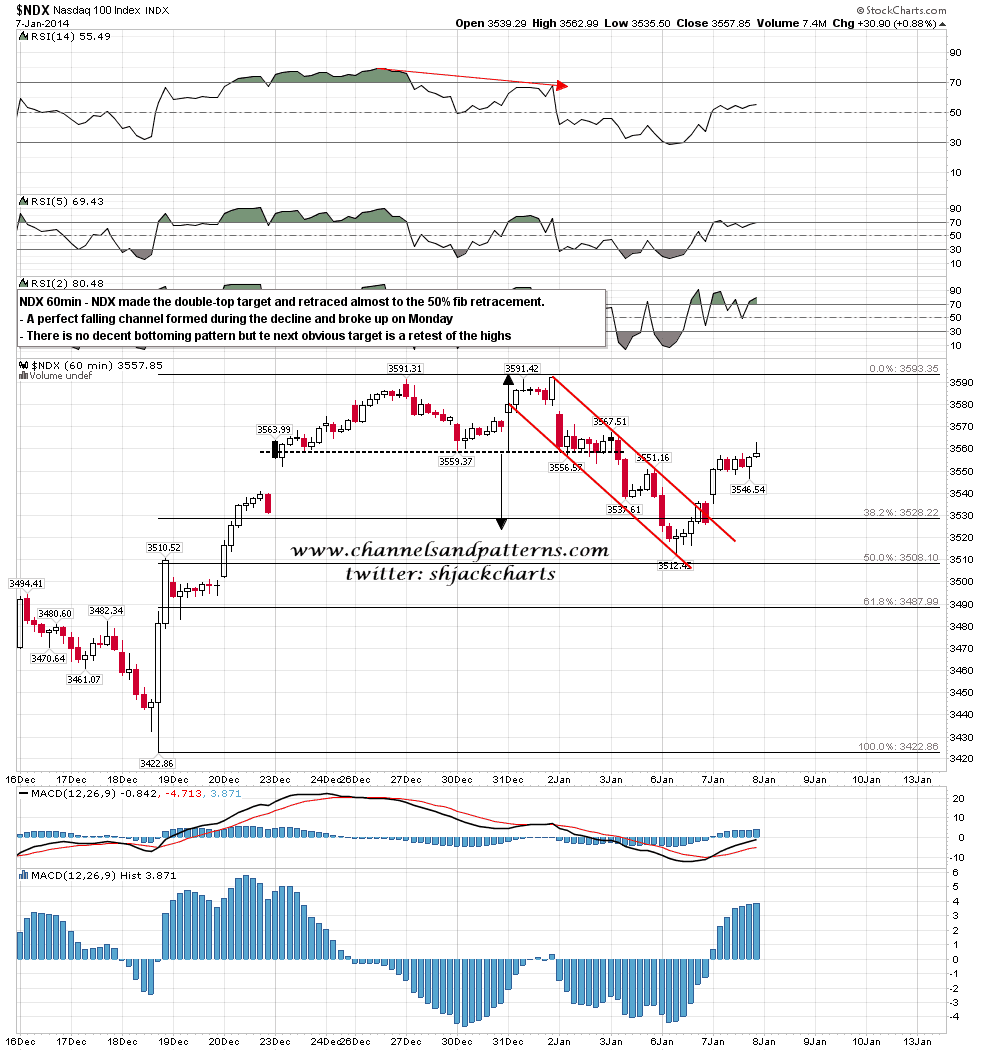
NDX made the double-top target there in a falling channel which has broken up. This is cautiously bullish though NDX is testing broken double-top support and could fail there. NDX 60min:
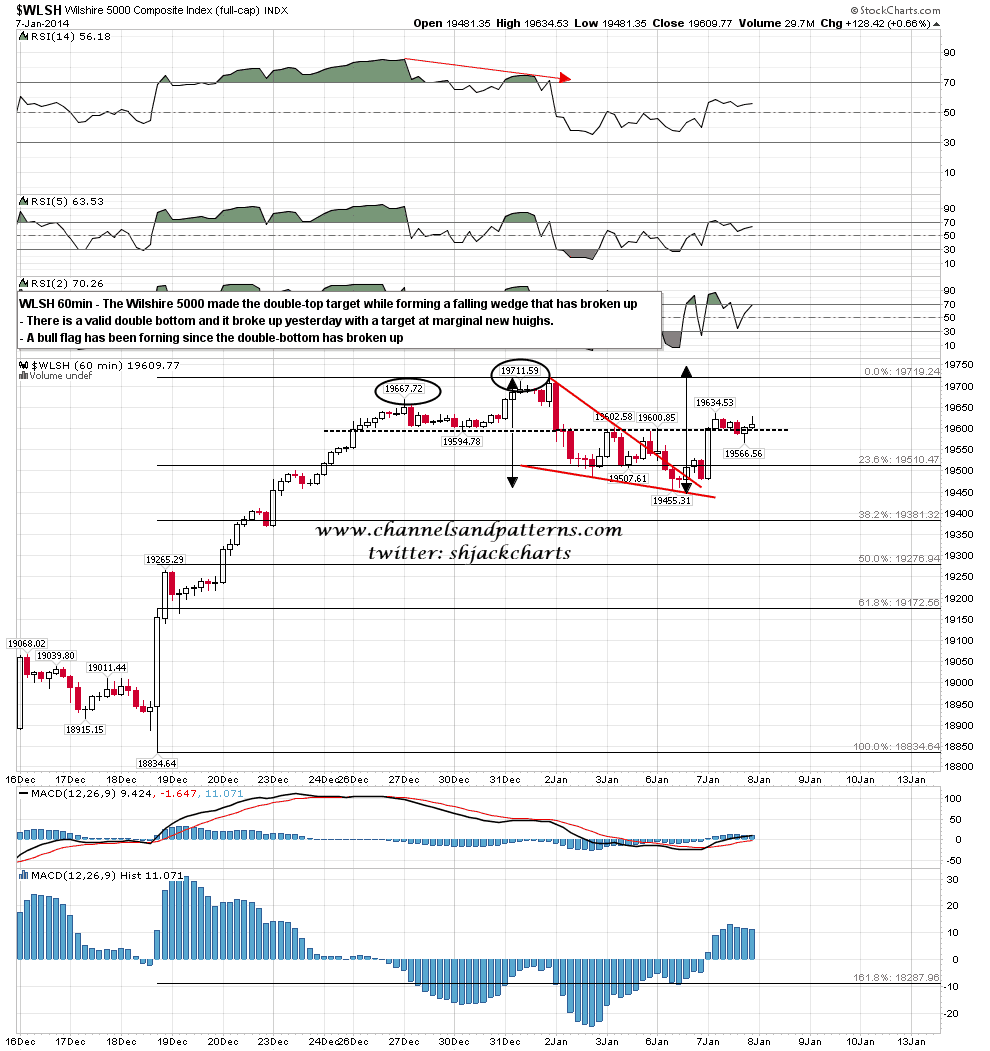
The very broad Wilshire 5000 made the double-top target there while forming a falling wedge that has broken up. As with Dow WLSH broke over double-bottom resistance yesterday and has formed a bull flag there. WLSH 60min chart:
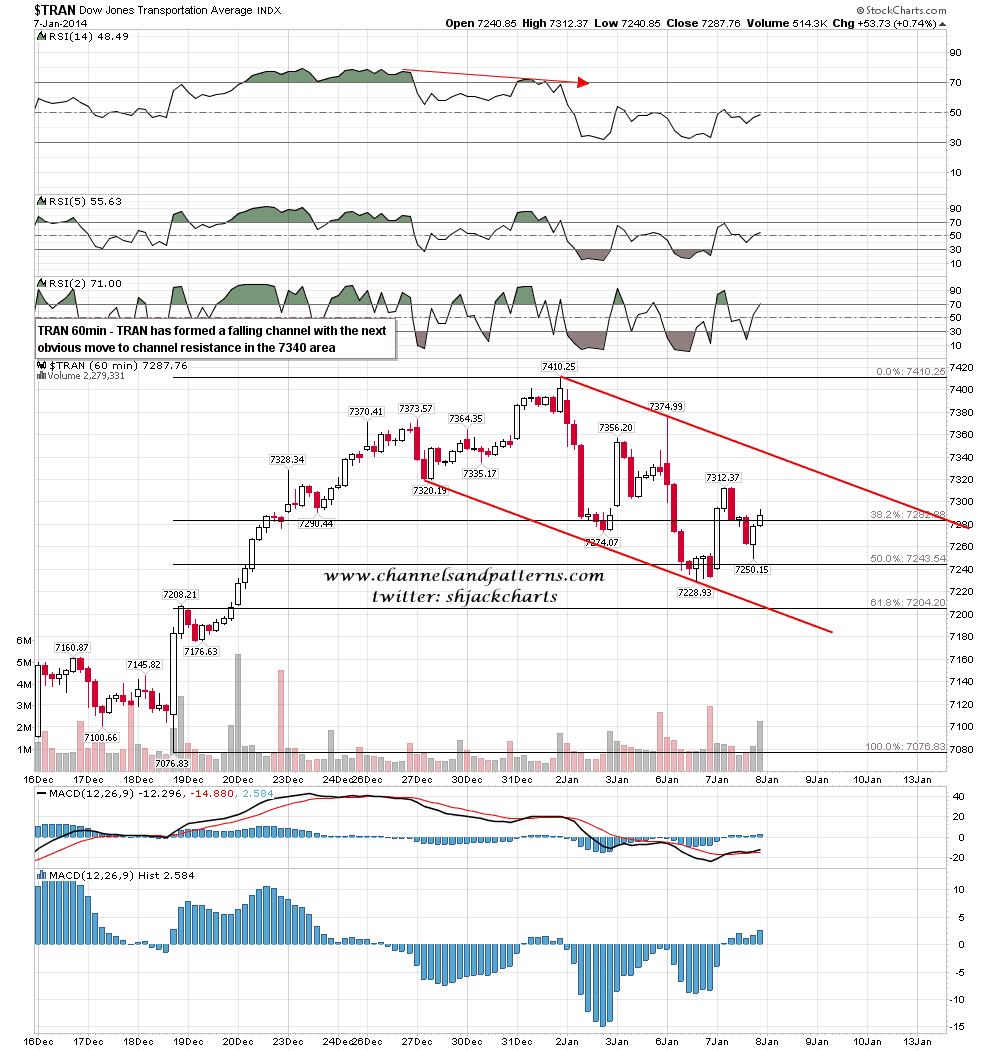
TRAN is an outlier here, as is often the case,as it has formed a large falling channel in the decline from the highs. Unlike the other indices it is not testing any strong resistance and the next obvious target is channel resistance in the 7340 area. TRAN 60min chart:
Overall my lean is long and the opening may well be very significant. If SPX gaps over 1838/9 at the open then a test of the current highs will be the next obvious move. If we see strong rejection at 1838/9 however then the downtrend may well continue, as it might even after a retest of the highs. If you look carefully at the SPX chart above then you can see that I have penciled in a scenario where the retracement so far has just been making the valley low after the first high of a larger double-top targeting the 61.8% fib retracement of the move after the Fed Taper announcement.
