
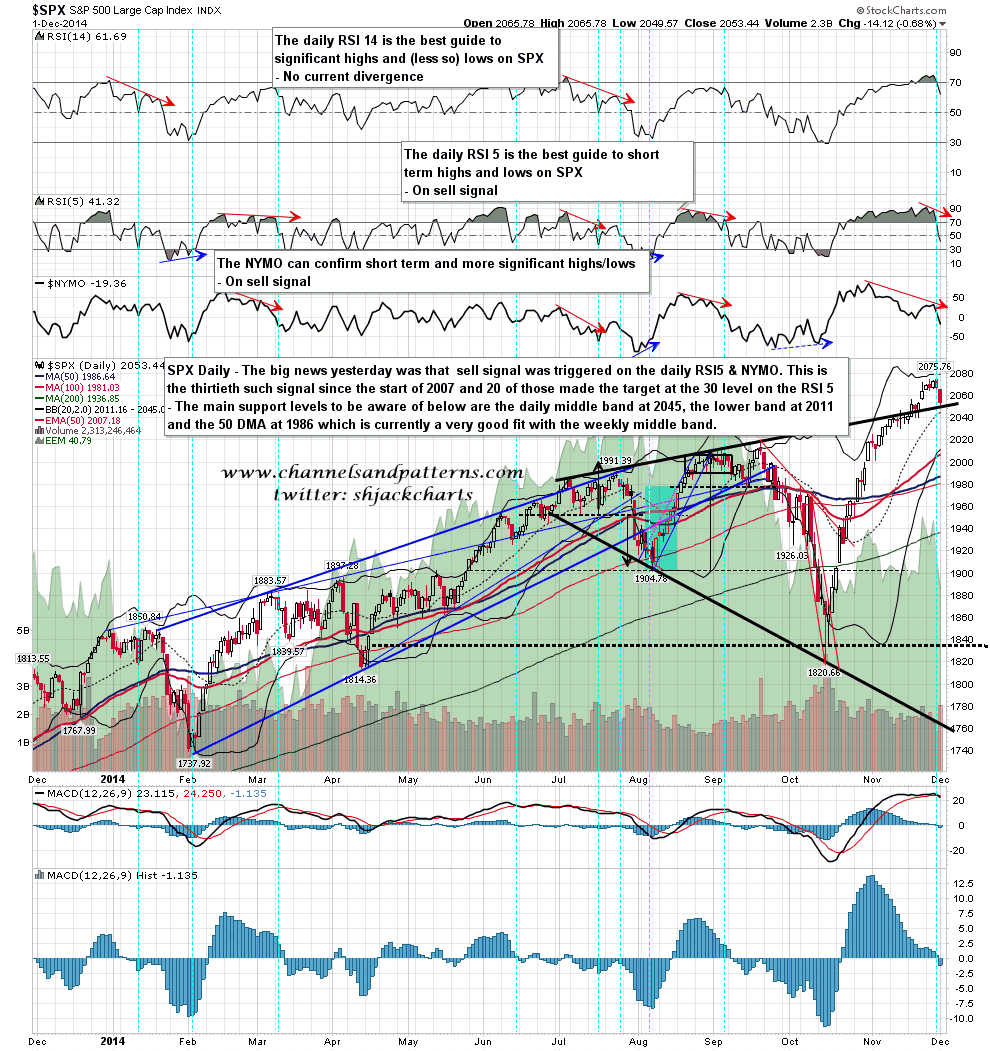
The big news yesterday was that a daily RSI 5 & NYMO sell signal was triggered. This is the thirtieth of these sell signals since the start of 2007 and 20 of the previous 29 made the target at the 30 level on the daily RSI 5. For this and other reasons I am looking lower here, though given the RSI 5 close at 42 yesterday we could see that signal target made in the 2030s or even possibly the low 2040s as long as the low was sustained into the close. SPX daily chart:
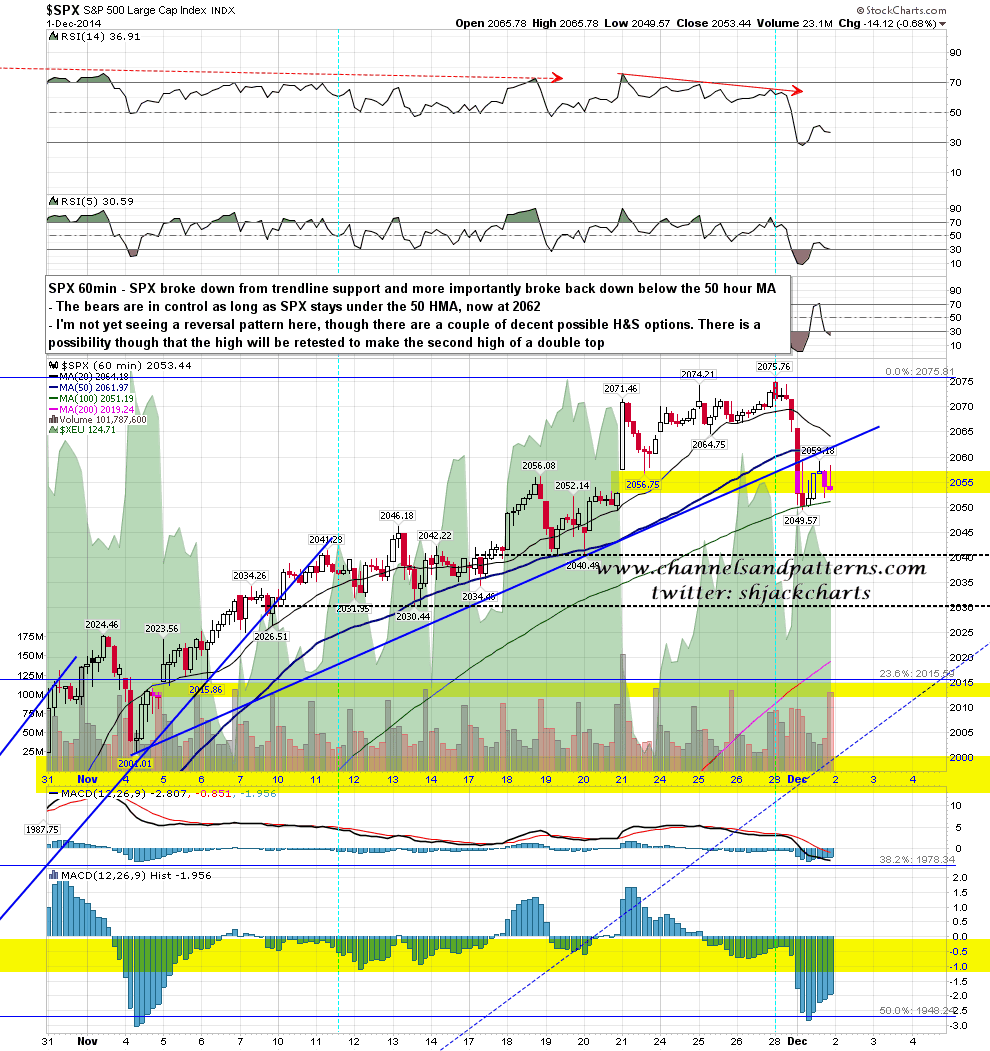
Main uptrend support at the 50 hour MA was broken at the open yesterday and SPX closed below it. Unless we are going to see a retest of the highs to make the second high of as double top I’m expecting that to be respected (currently at 2062) until the end of this retracement. As alternative topping patterns I have possible H&S necklines in the 2040 and 2030 areas. SPX 60min chart:
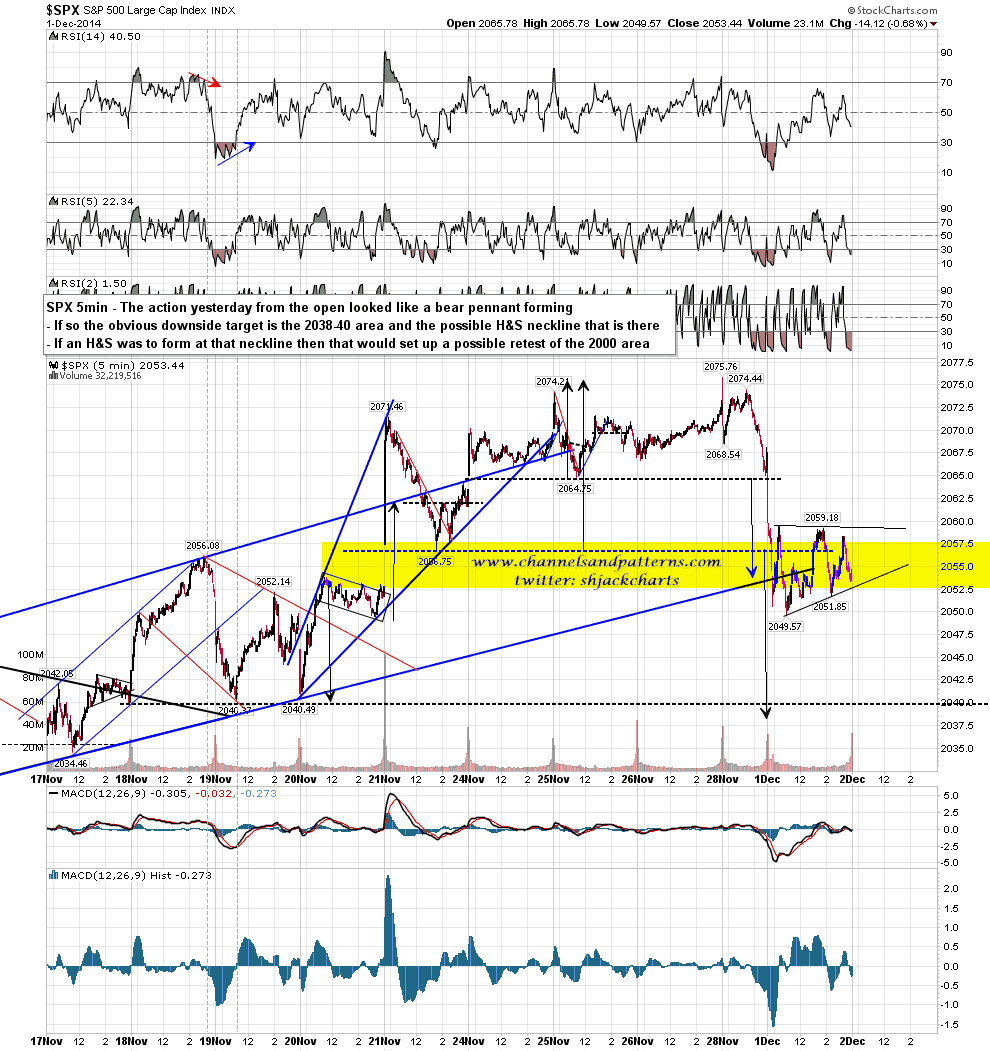
The intraday action on SPX yesterday looks rather like a bear pennant and I have an open small double top target in the 2038-40 area. That would be a good fit with the possible H&S neckline in the 2040 area and not far below the daily middle band at 2045. SPX 5min chart:
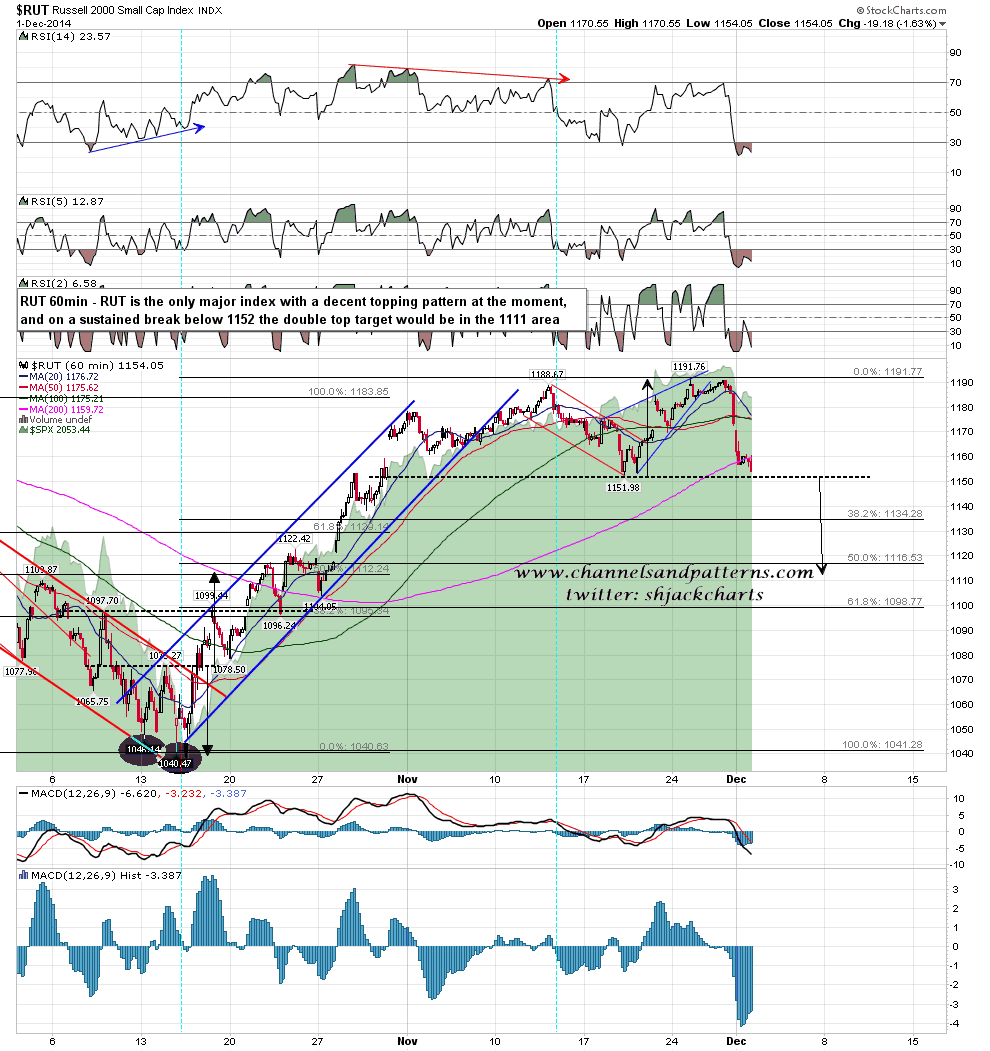
I did an optic run of the US indices 60min charts last night and there is only one that has already formed a decent reversal pattern and that is (naturally) RUT. On a sustained break below 1152 the double top target on RUT would be in the 1112/2 area. RUT 60min chart:
The daily sell signal and the historical stats have me looking lower here. I see possible retrace target areas in the 2040, 2030, 2020, 2010, 2000, and 1990 areas. I’d be very surprised to see this retracement get below 1990 but as for the other target we will need to see what reversal pattern forms here on SPX and use that as our guide. I think there’s a good chance that we see 2040 SPX tested today.
