
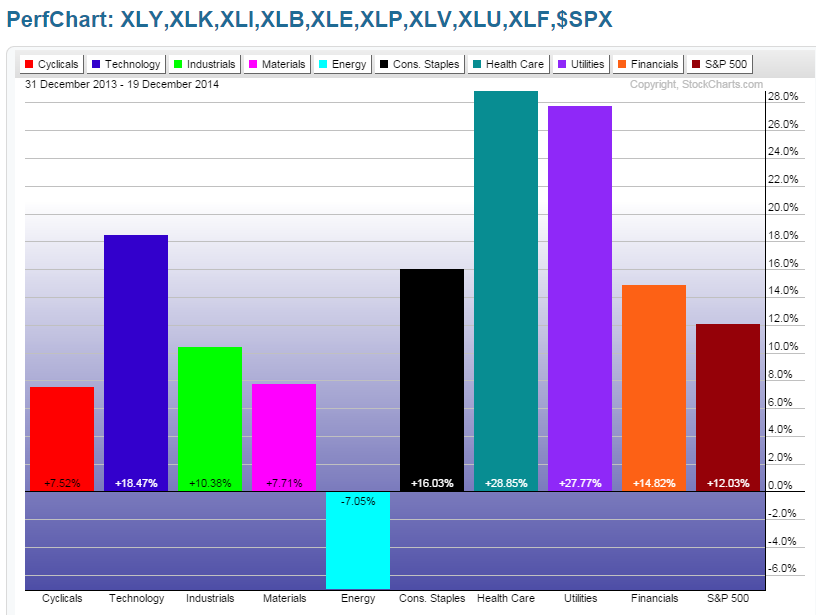
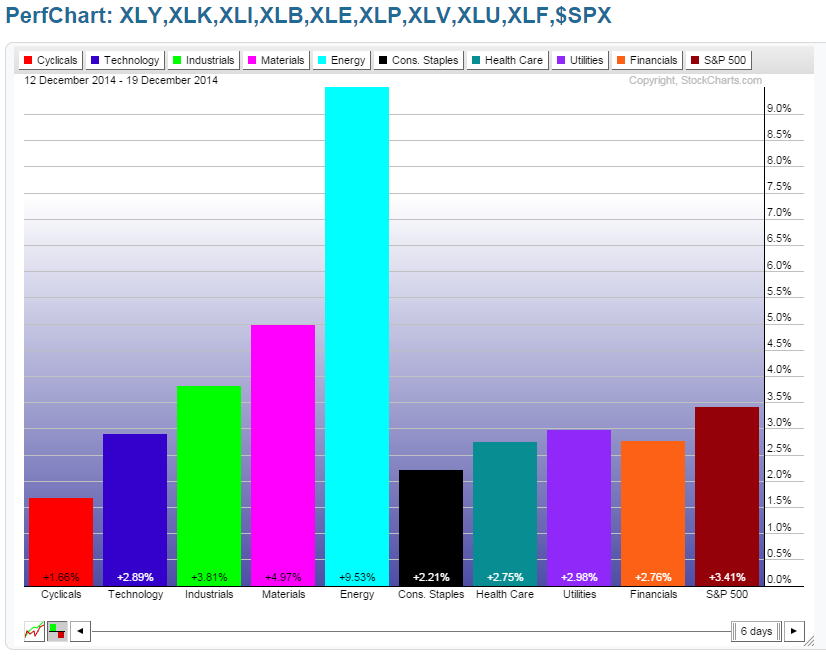
As you can see from a comparison of the following two percentage gained/lost graphs of the 9 Major Sectors (plus the SPX), (the timeframe on the first graph is year-to-date, and on the second is this past week), market participants ventured into the “riskier” sectors to add more risk this week.
The second graph shows that Energy and Materials contributed substantially to the lift in equities this week…look for that trend to either continue, or reverse, if commodity prices begin to plunge again.
We’ll see if this very recent rally continues to the end of the month/quarter/year…and, whether the SPX will reach its next resistance level of 2150, as mentioned in my posts of December 3rd, and, more recently, December 13th, if not by Christmas Day, then, perhaps, by the end of this year.
In this regard, the following two Daily charts provide updates on Friday’s closing level of the SPX and the SPX:VIX ratio. Current price levels on both charts are back above near-term resistance levels of 2000 for the SPX and 120.00 for SPX:VIX. Failure to hold these levels could send price tumbling to re-test their prior swings lows, or lower. The Momentum indicator is still below zero for both charts, so we’ll need to see these rally and hold above zero to confirm any further sustainable buying in equities.


