
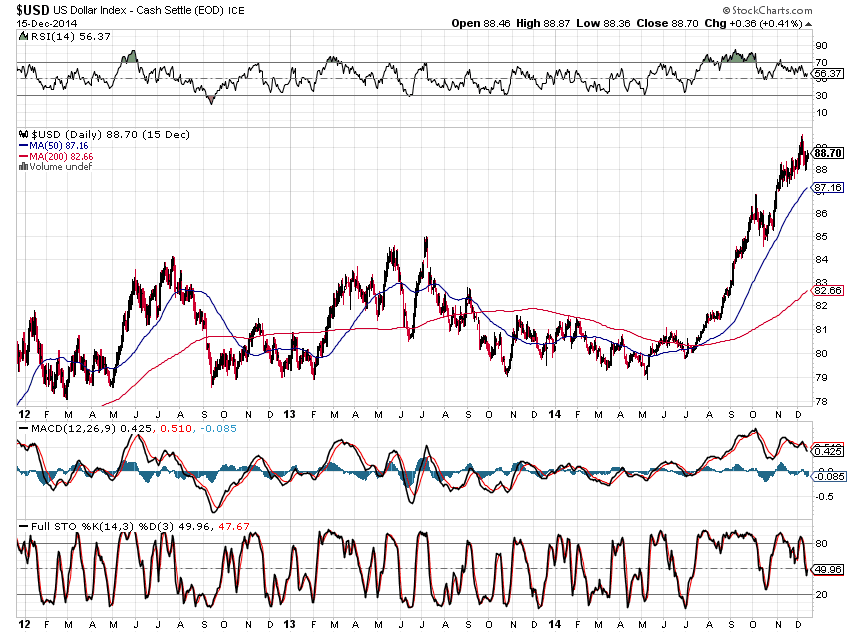
The USD has been under accumulation since May of this year when it bounced around 3-year major support from late October 2013, as shown on the following Daily chart.
With daily whip-saw action that began in November, we’ve seen the RSI come off its highs, but remains above the 50.00 level. The MACD and Stochastics indicators have also been sliding. These are suggesting that we may see either a slowing in buying of USD, or a rotation into other world currencies.
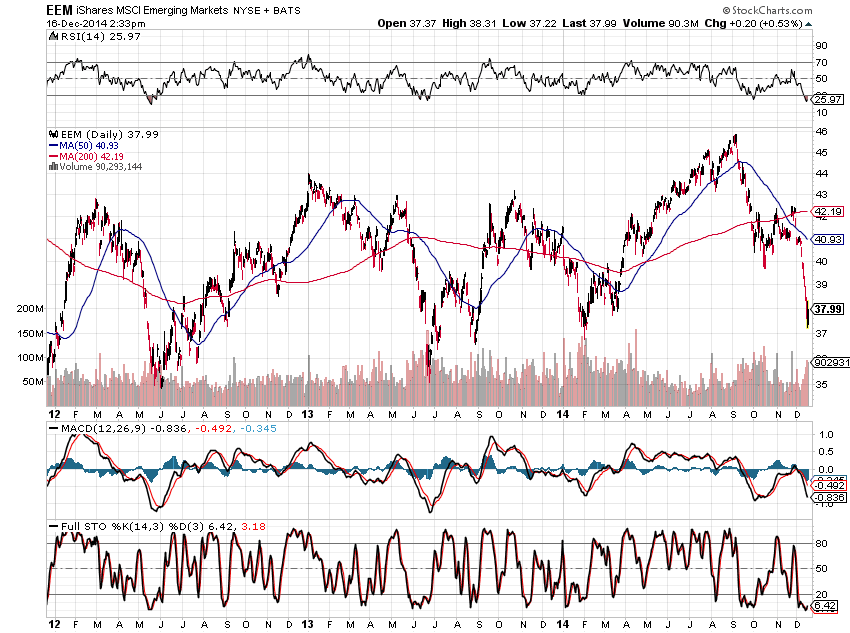
Conversely, we’ve seen a great deal of weakness in Emerging Markets, as shown on the Daily chart below of EEM. Price has approached 3-year major support around the 37.00 level on increasing volumes, and all three indicators are down around the oversold levels, but have yet to signal that a reversal has begun.
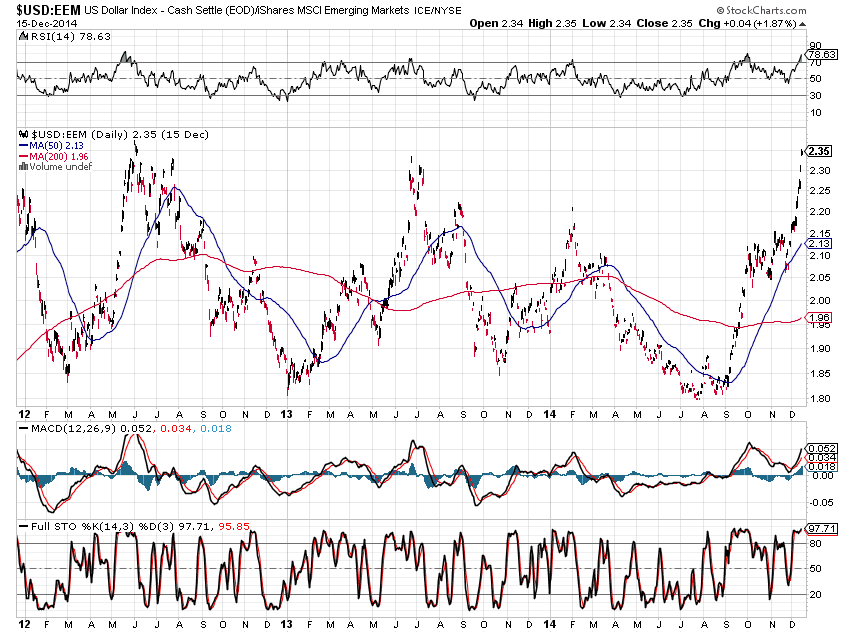
The following ratio chart of the USD versus EEM shows that each time that the current level has been reached over the past 3 years, we’ve seen a subsequent decline in support for the USD and renewed buying in EEM. All three indicators are up around the overbought levels, but have yet to signal that a reversal is imminent.
These three charts, and the extent of any upcoming near-term volatility in these two instruments, may be worth monitoring until the price of Oil stabilizes, and other world indices begin to strengthen…or not. It may be that we will see larger volatility ensue in currencies, before they play out to any great extent (or near-term trends become very clear) in world indices.
