
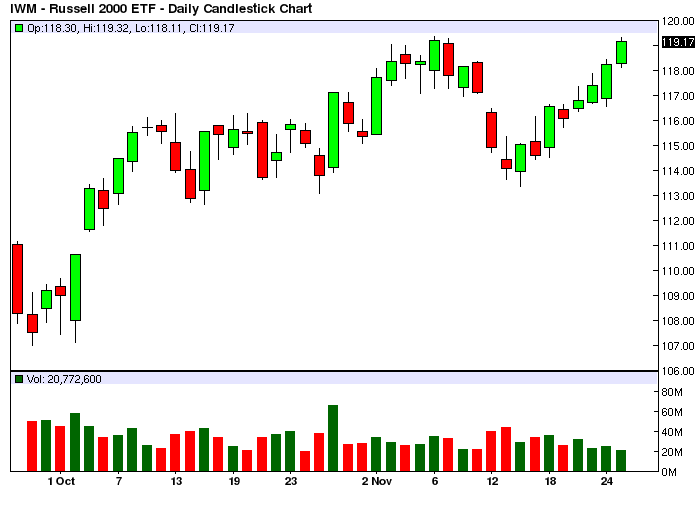
IWM has been pushing up quite strongly as of lately, it is up 4 days in a row and in our view ripe for some pullback soon.
As you know Retracement Levels does not care about charts, it is a purely quantitative model that looks at price patterns and compare the current retracement with thousands of historical similar retracements in a database (the criteria are all mathematical, not chart-based).
The model is able to determine the price range where a new retracement is more likely to happen. This enables the trader to place systematic bets in that range with a high chance of success. The difference with Technical Analysis is that TA infers where the price will go by looking at geometric shapes and trendlines on charts, but without any statistical inference involved and thus the deductions are heavily deformed by the bias of the observer plus they have no science in it, they are blind gambles.
What RL tries to achieve is to capture the repetitive market patterns and tell the trader where to place his bets to capture again this constantly repeated/repeatable activity.
Here are the tradable levels for IWM, you can go SHORT anywhere above ~119, the odds of seeing a retracement from there are very good, you can average down or use a Stop Loss method, our model lays out for you all the details, it’s a no-brainer (we also provide courses, if you want to dig deeper into this):

Click here if you want to gain access to all our quantitative trading models, we cover a number of selected ETFs, FX Spot, Indices and Futures markets (full list).
