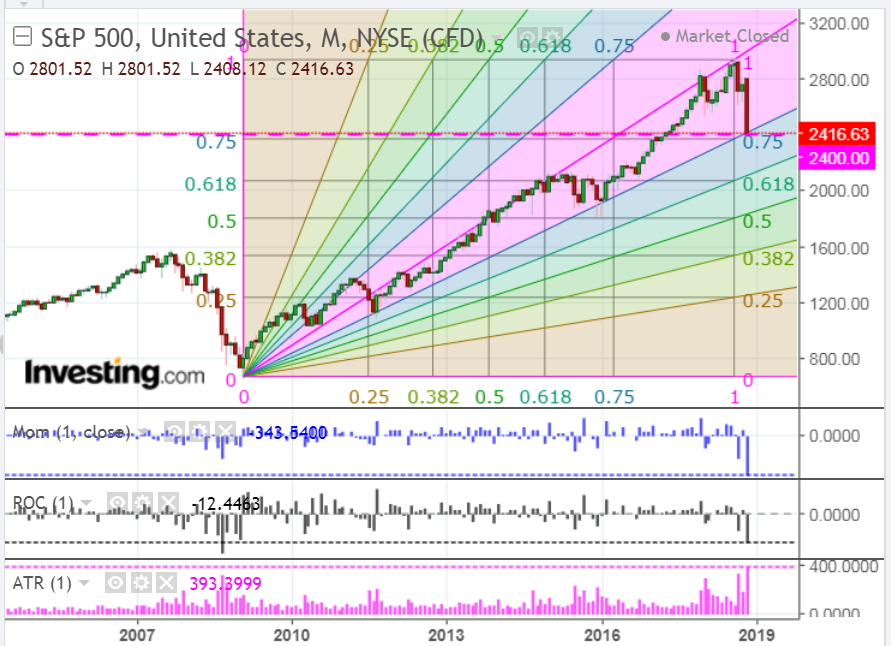
Further to my post of August 6, the SPX continued to rally to top out in September about 100 points shy of an upside target of 3033, but exceeded its first target of 2900, as shown on the following updated monthly chart. The high was 2940.91 and I doubt we’ll see that matched before the end of December.
Since then, and as of Friday’s close, the SPX has plummeted and it came within eight points of reaching its first major support level of 2400, as I described in my post of December 17.
The input value for each of the three technical indicators is shown as ‘one’ to illustrate the extreme downside momentum, rate-of-change, and average true range experienced, so far, this month. These either exceed or almost match the levels experienced during the 2008/09 financial crisis.
Whether we see a short-term bounce next week to close out the year is anyone’s guess.
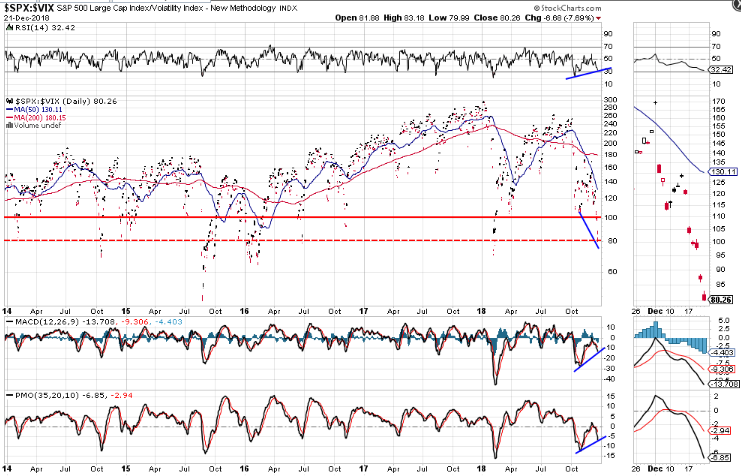
However, the RSI, MACD and PMO divergences (shown on the daily chart of the SPX:VIX ratio) compared to the ratio price is hinting that we may either see a bounce in the SPX or some stabilization soon.
If we see the SPX continue to plunge and these divergences wiped out, we may just see the SPX reach its next major support level of 2250, or lower to 2000, as described in my last post. A drop and hold of the ratio below 80 could hold the key to such a scenario being achieved…in short order.