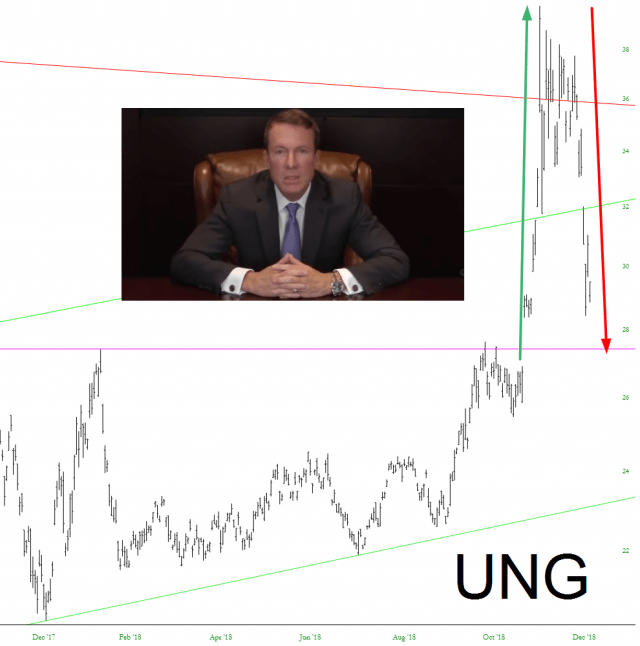
What a difference a single month can make. Observe the chart of the natural gas market below. Once it pushed past resistance (pink horizontal line) it went roaring higher, devastating – – notably – – James Cordier and his OptionSellers.com fund, purportedly to the tune of $200 million. And then, equally as fast, all the gains disappeared. It’s as if nothing happened.

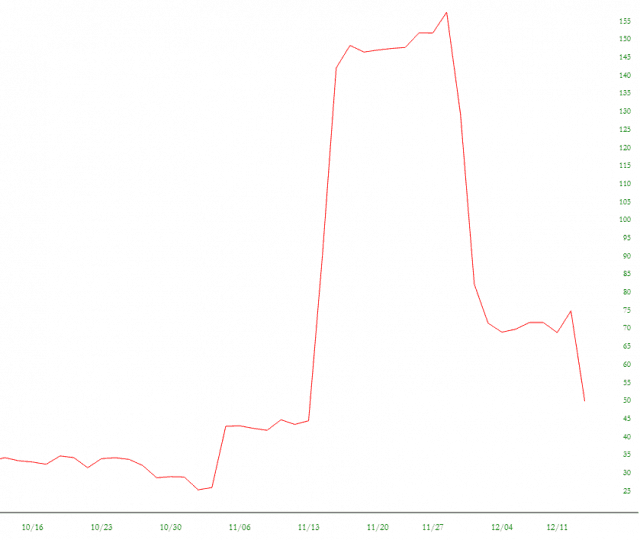
Looking at the Volatility chart (thank you, SlopeCharts……….) provides a more specific view as to why a short position in these naked options would be such a wipeout. And, again, the explosive move in price has pretty much vanished.

The chilling thing is that if you are James Cordier and decide to Google yourself, what appears as the very top results are advertisements from lawyers.


