Monday was one strange day in the market. The three words that describe it best are: Bearish Engulfing Pattern. That is, the candlestick whose body completely consumes the prior day’s body. And here we go:

Slope initially began as a blog, so this is where most of the website’s content resides. Here we have tens of thousands of posts dating back over a decade. These are listed in reverse chronological order. Click on any category icon below to see posts tagged with that particular subject, or click on a word in the category cloud on the right side of the screen for more specific choices.
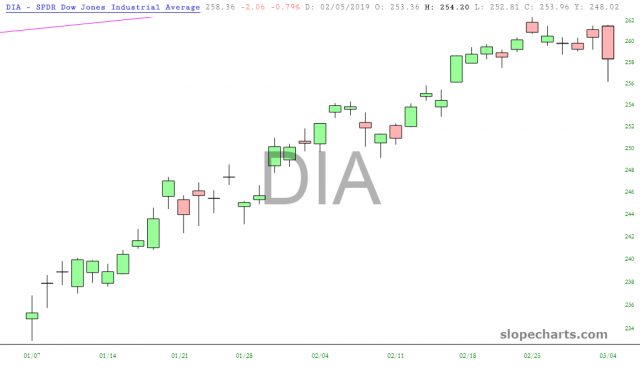
Monday was one strange day in the market. The three words that describe it best are: Bearish Engulfing Pattern. That is, the candlestick whose body completely consumes the prior day’s body. And here we go:
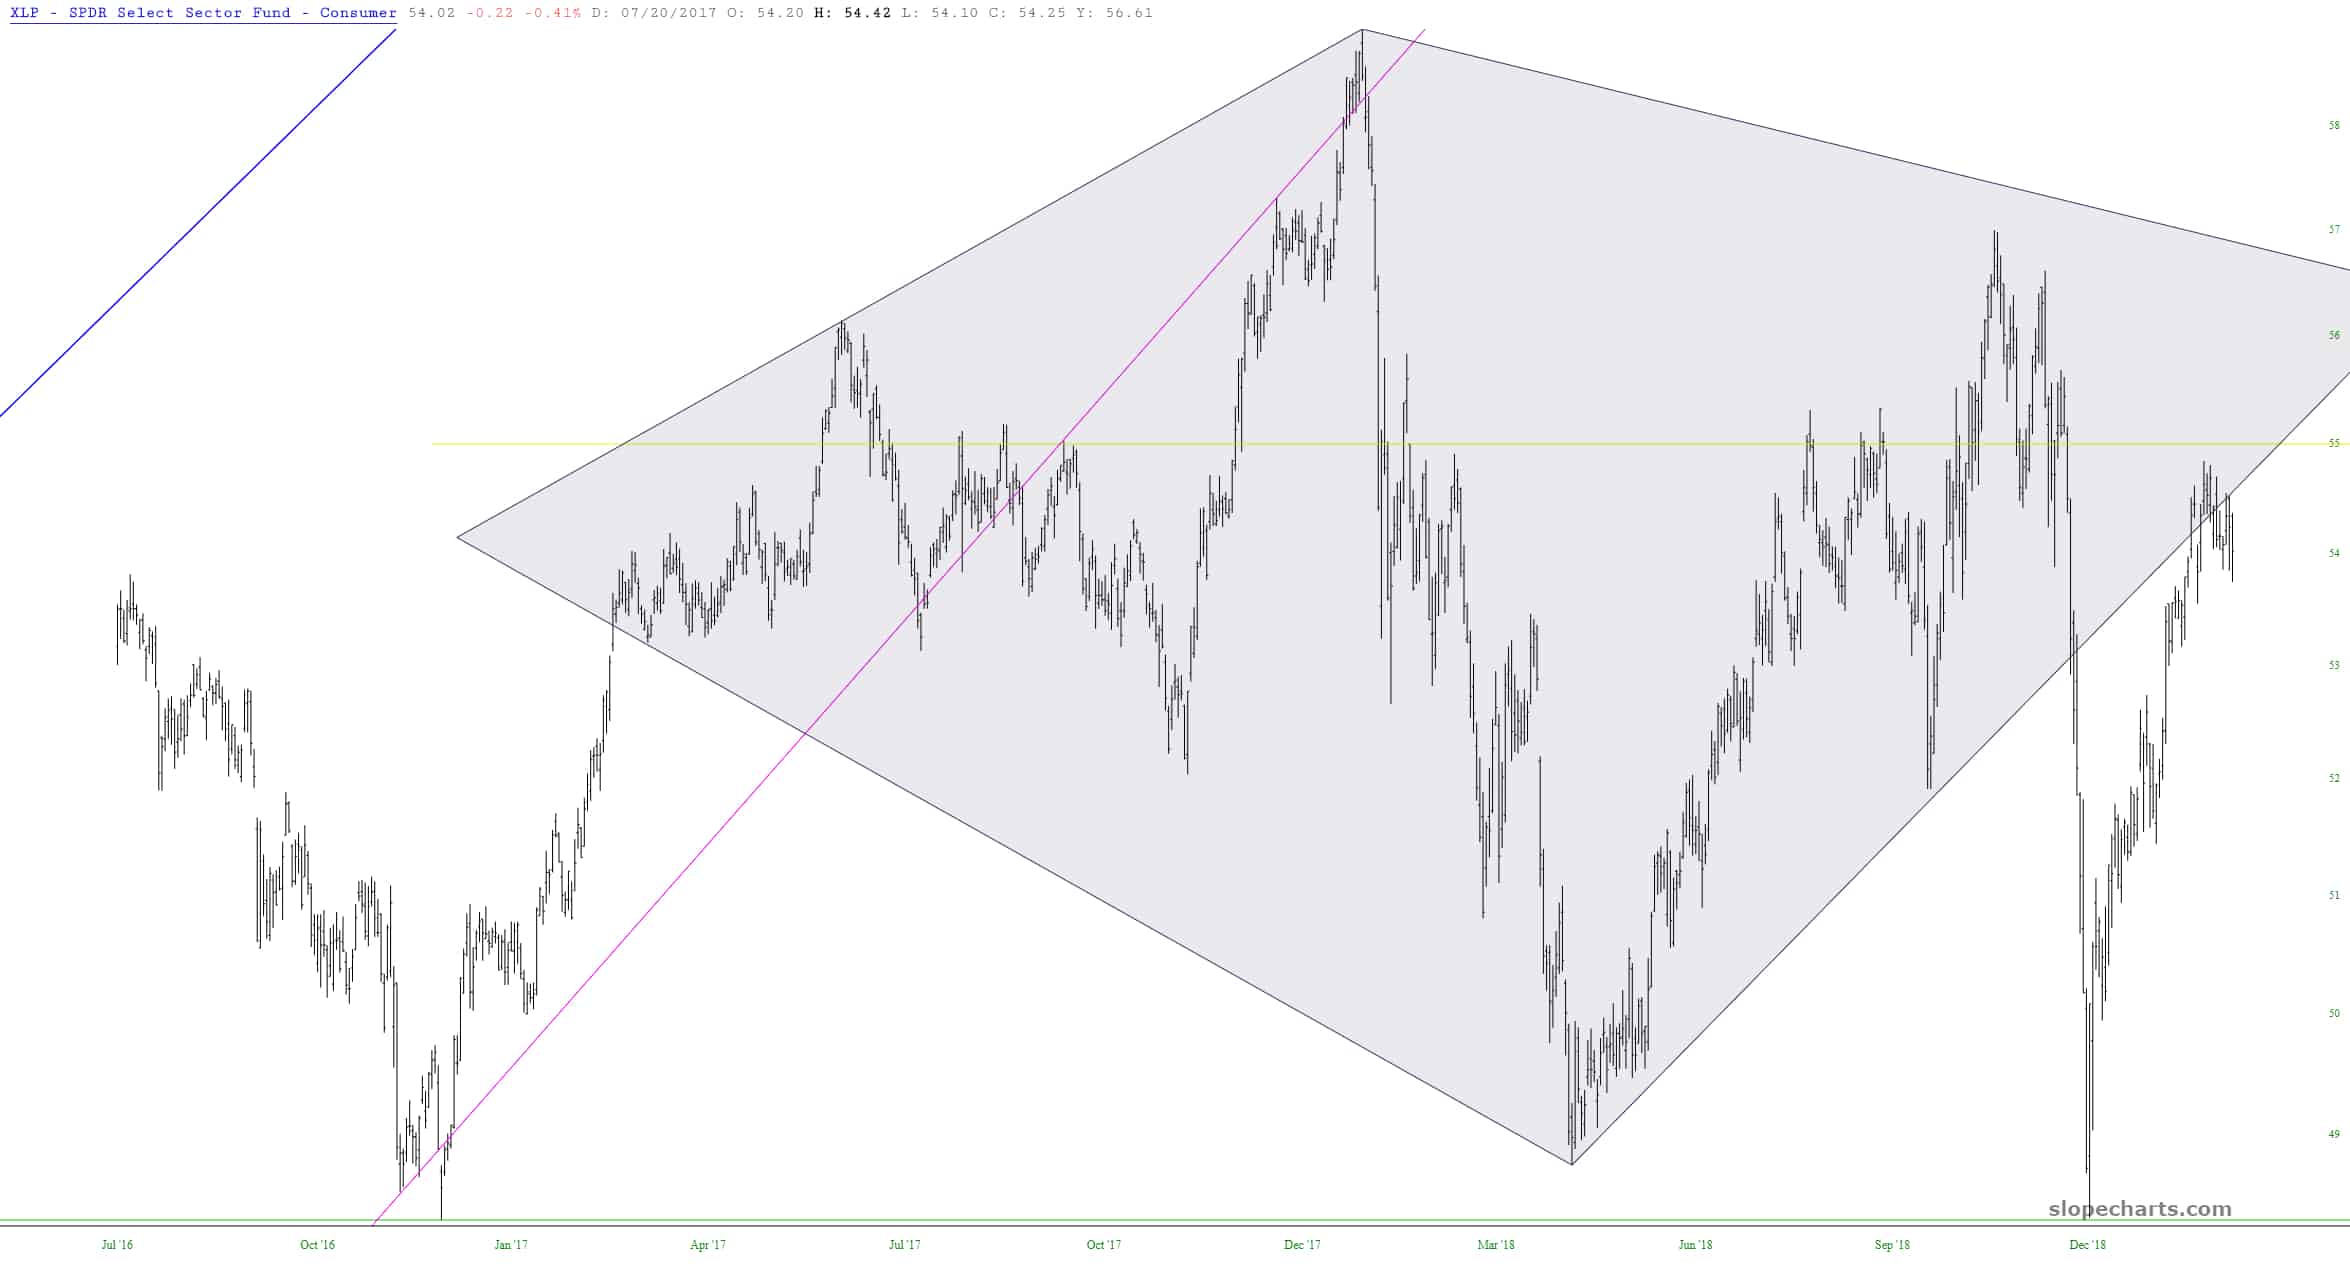
Just a reminder that the consumer staples ETF symbol XLP is still sporting one of the largest and cleanest diamond reversal patterns I’ve ever witnessed.
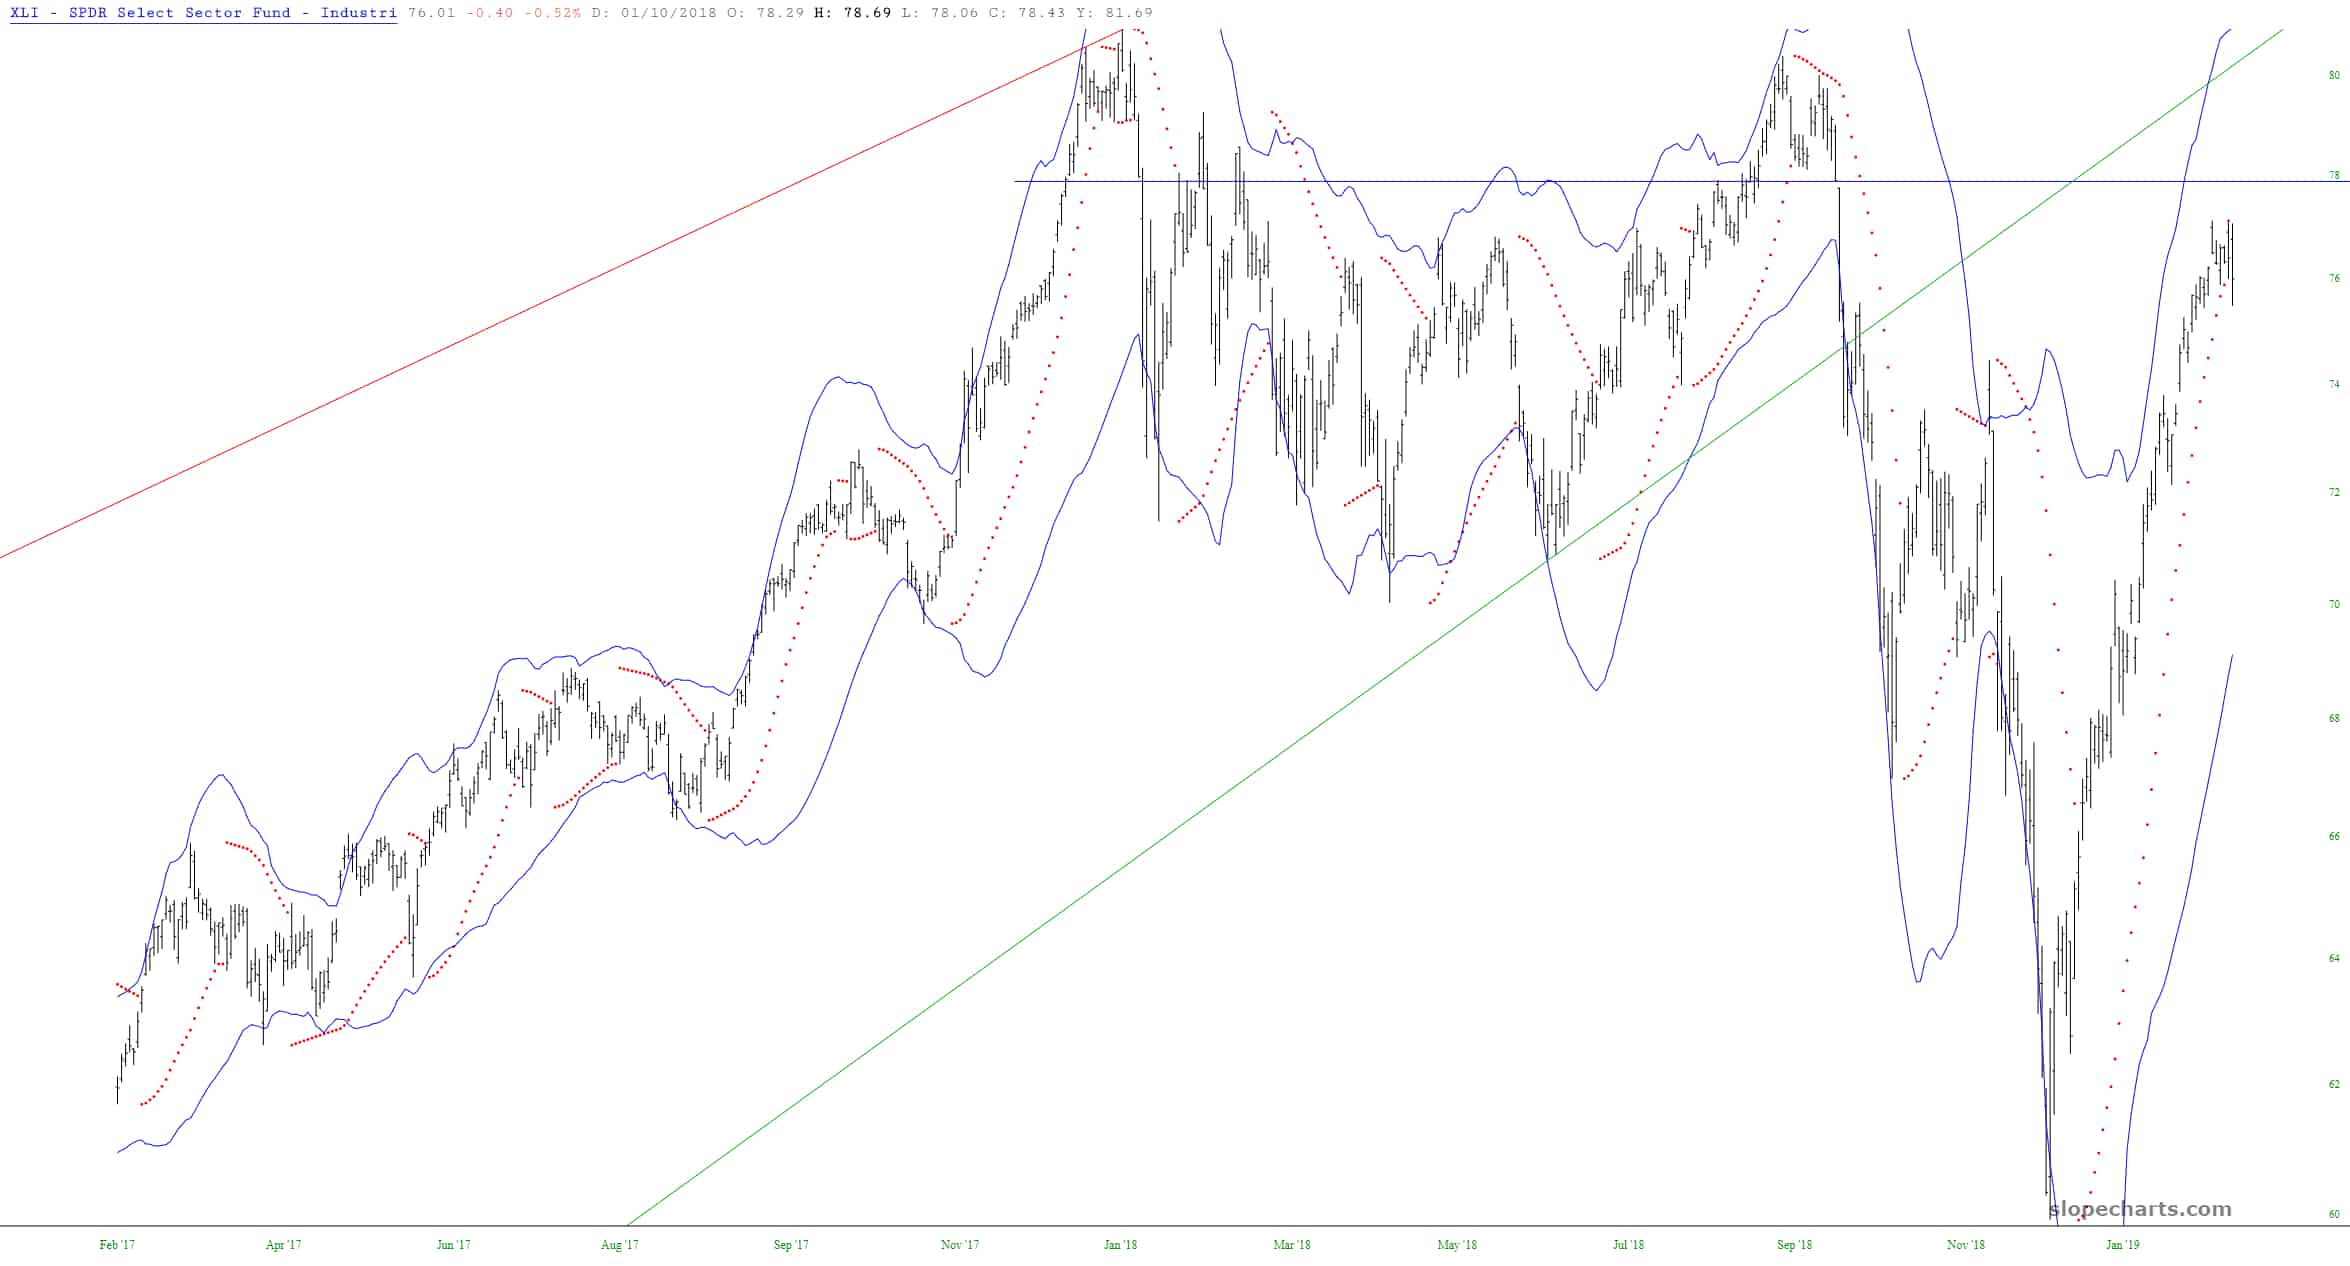
For Industrials ETF symbol XLI, the Parabolic Stop and Reversal indicator (PSAR) in SlopeCharts has, for the first time since December 4th, flipped bearish.
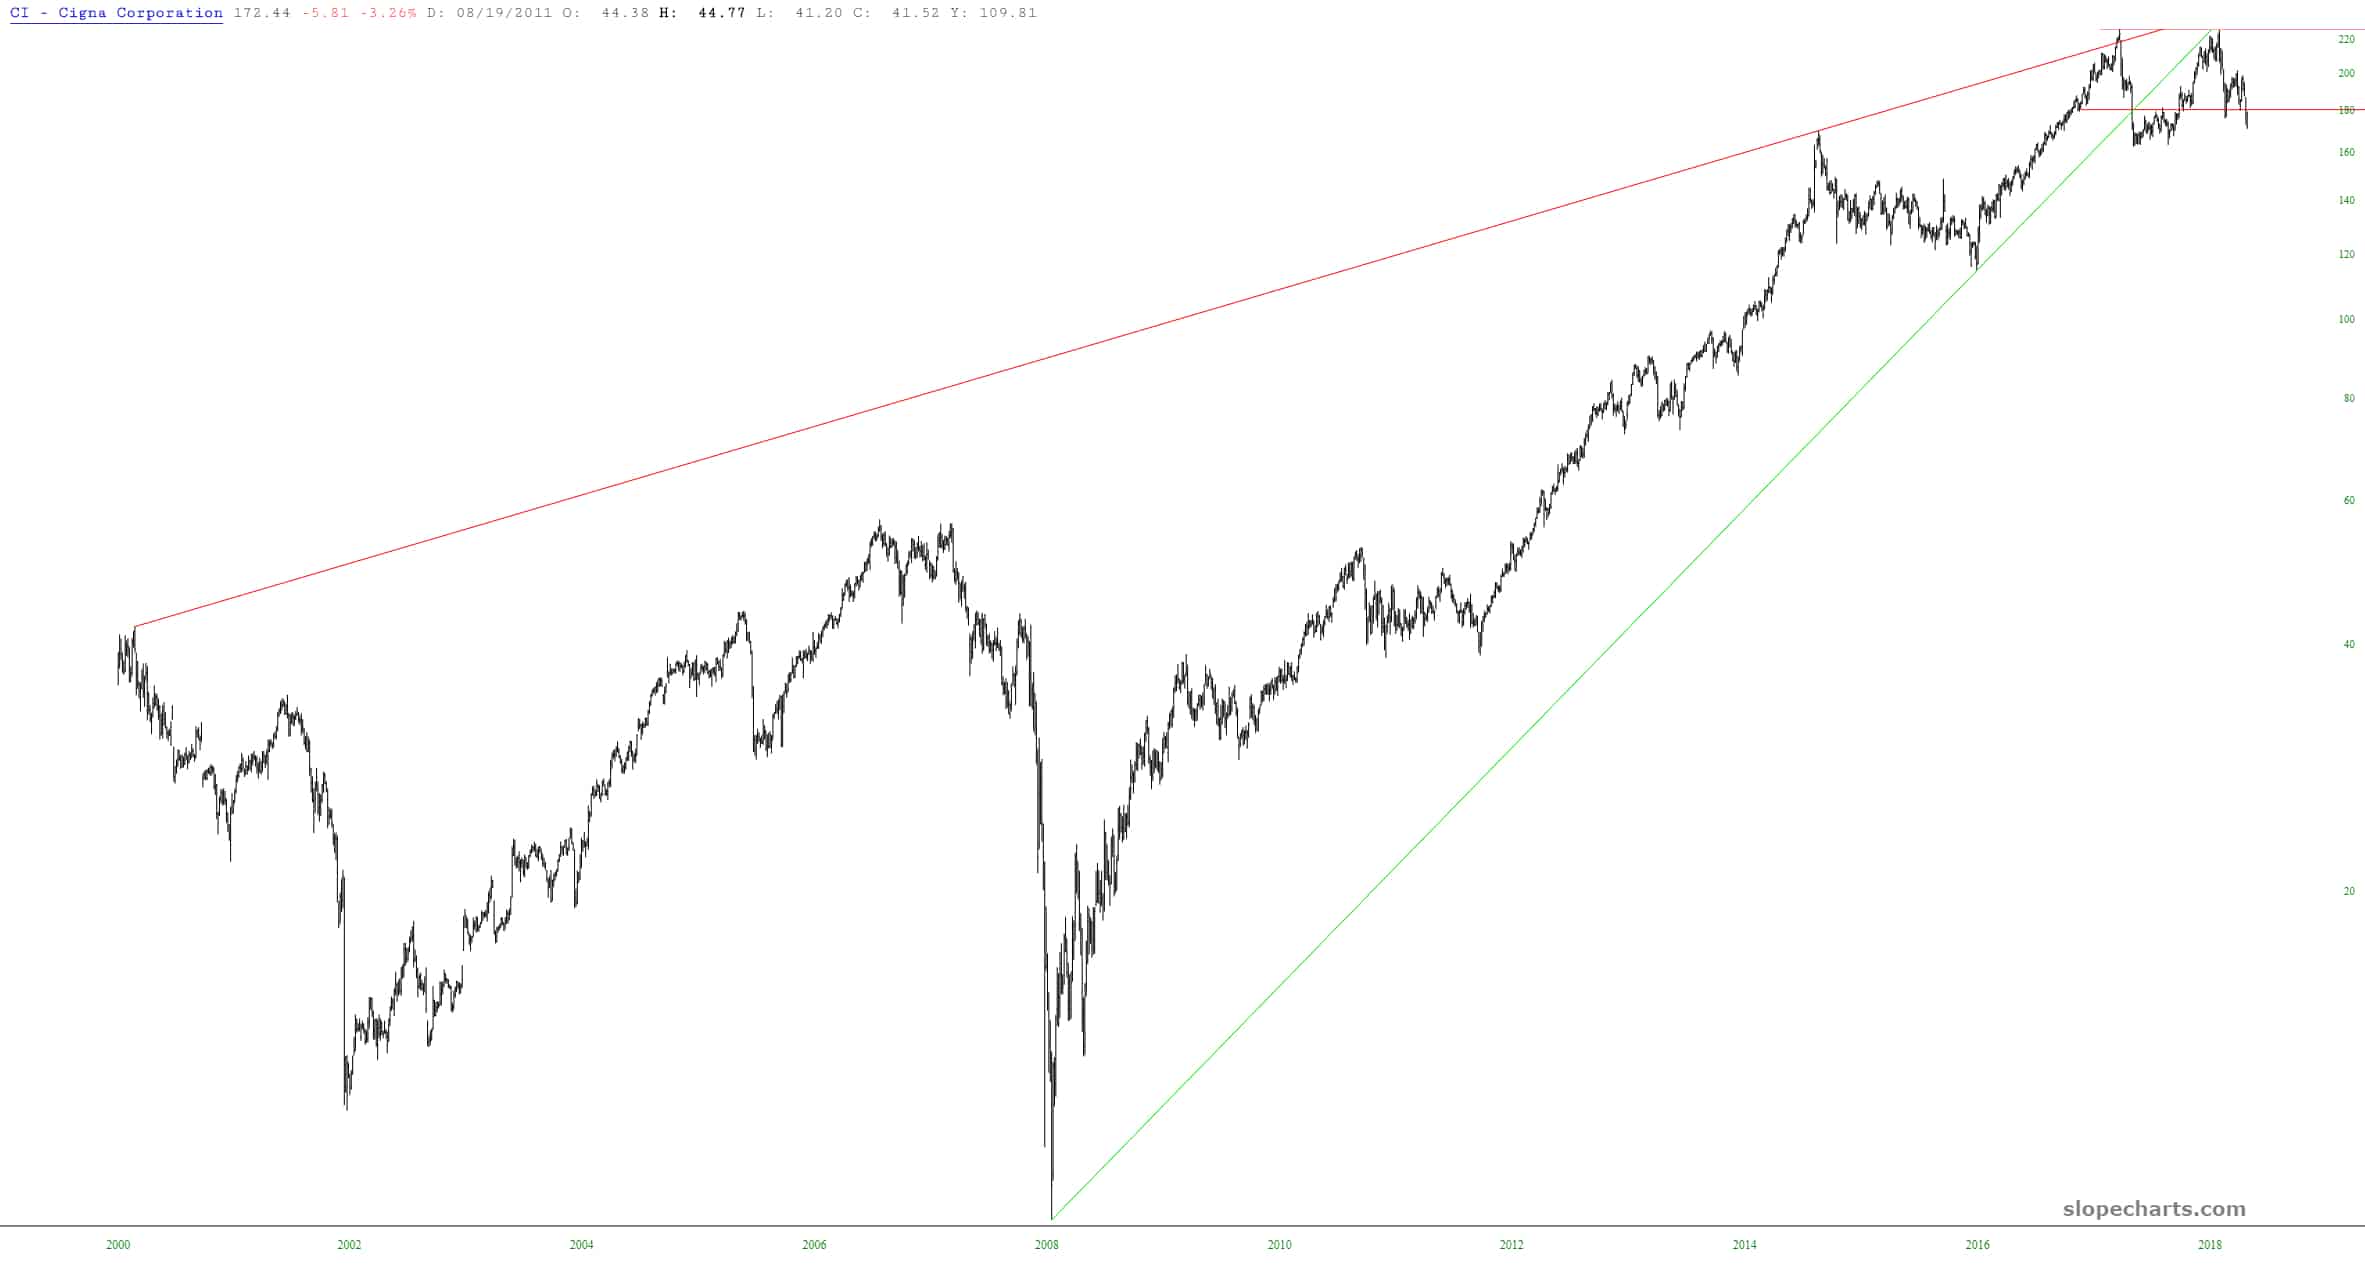
I follow financial stocks closely, and one which stands out to me as a particular under-performer is Cigna (symbol CI) shown here.
OK, I’m done changing my adult diapers, and I’ve washed my hands, so I can put out another post. Observe below the S&P 500 along with the “limit line” which has been in place for MONTHS now:
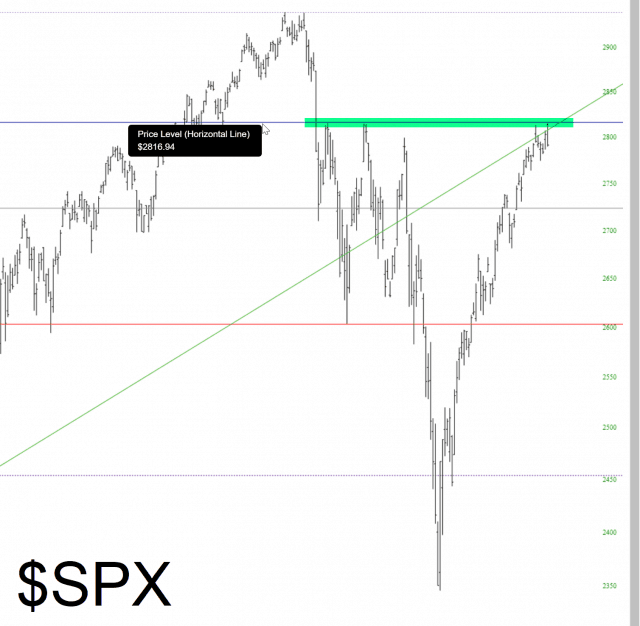
Today’s high came with 0.06 points of the line. Zero. Point. Zero. Six.
Today’s ticker symbol is JFC.
