Happy pre-Thanksgiving to Slopers. To be clear, today is a full trading day, and Friday is a shortened day, closing three hours before normal.
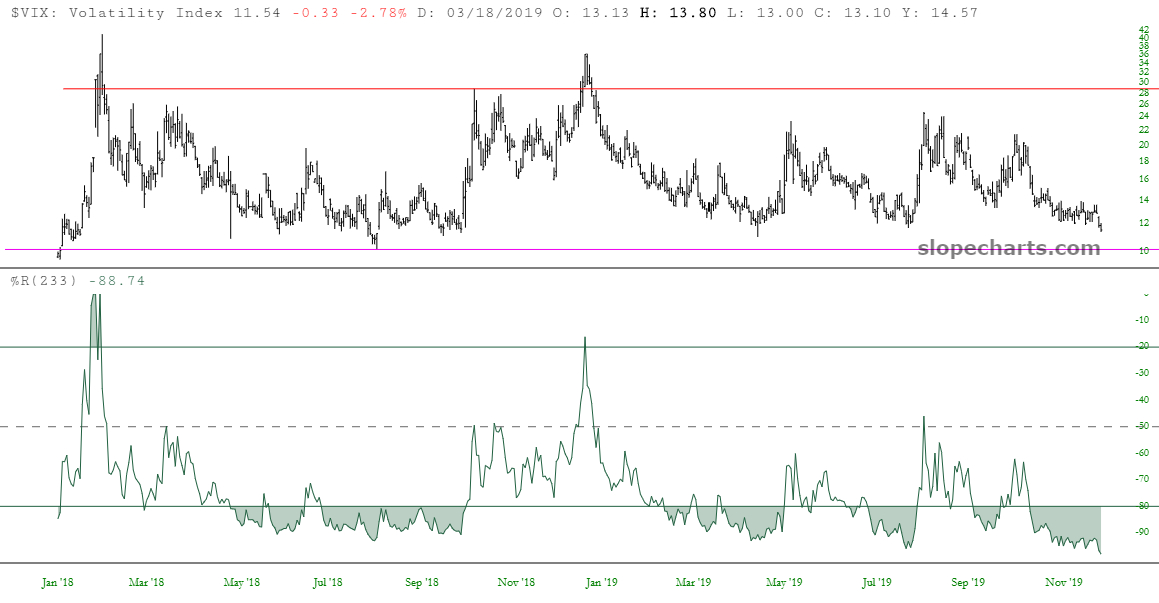
I wanted to thumb through a few big cash index charts. In most of these cases, they have blown right past their Fibonacci extension targets (thanks to Powell’s QE4). These extensions are based on major high/low anchor points, and are represented by horizontal lines. Here is the Dow Composite:
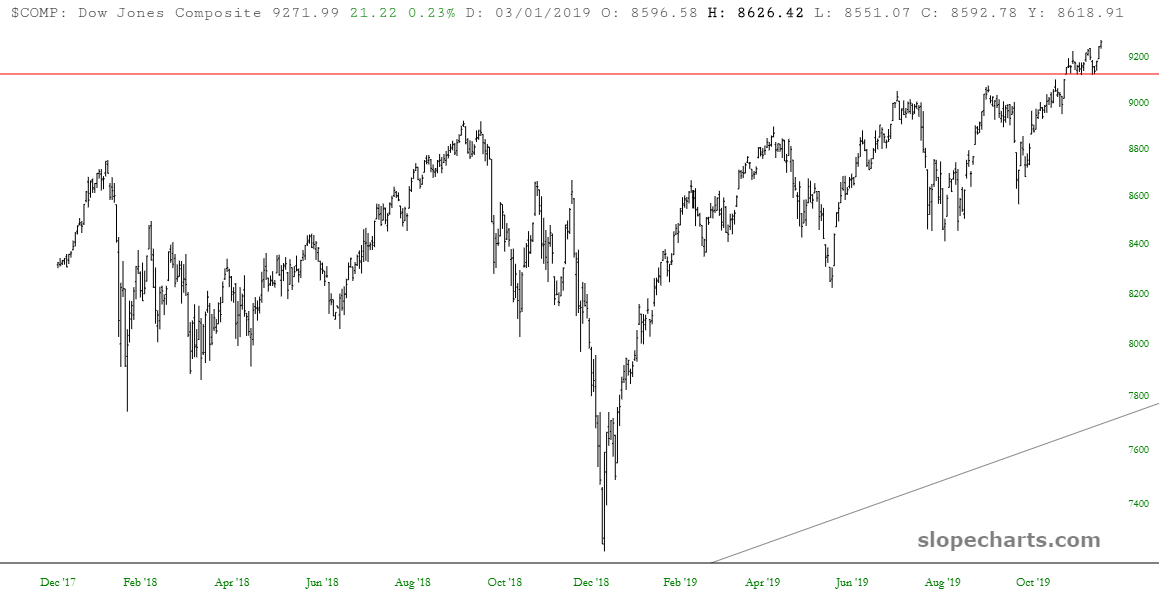
The Dow 30 Industrials:
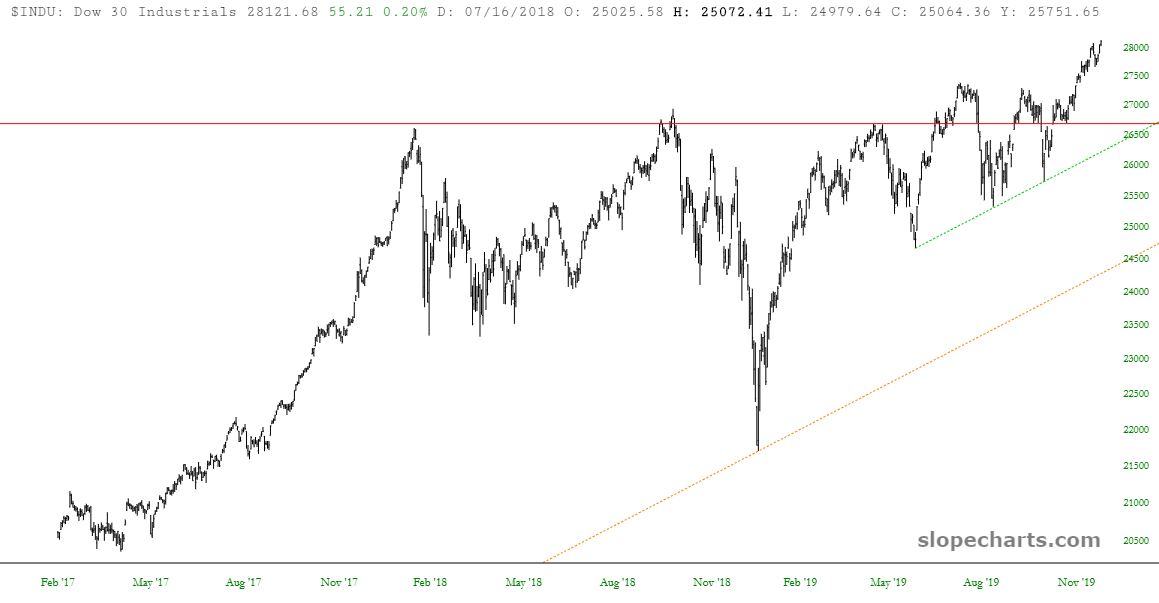
The S&P 500:
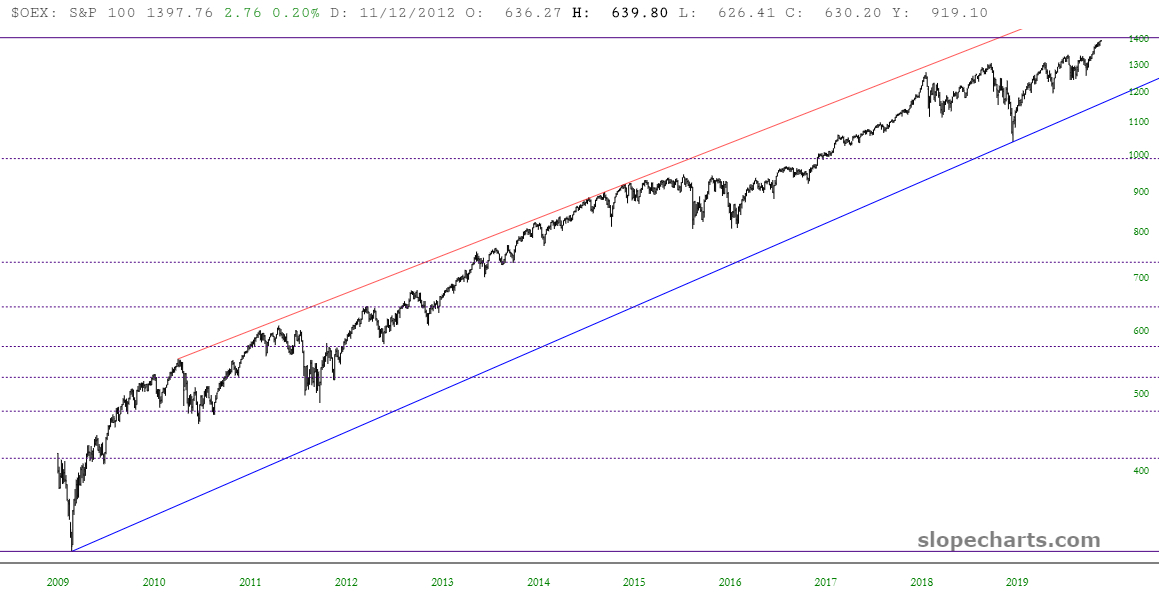
Just about the only “holdout” at this point is the S&P 100, which is about 0.8% from its extension target. I have shown much more data here, simply to illustrate the various Fibonacci retracements along the way, in addition to its ascending channel.
The small-cap Russell 2000 is one of the very few major indexes well beneath its lifetime high and beneath its extension. Indeed, it exceeded its extension back in 2018 (note horizontal) but went plunging beneath it in Q4 2018, which was prior to the Mnuchin interference. Earlier this week, we blew past medium-term resistance (the lower horizontal) and are above the diamond pattern as well, suggesting a bullish continuation.

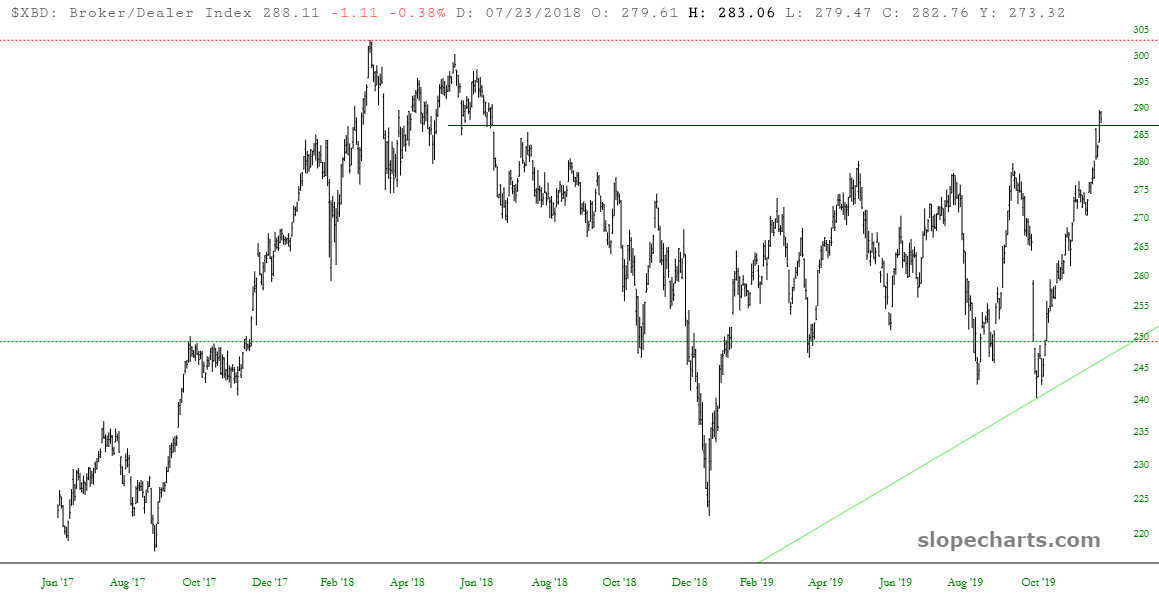
Likewise, the broker/dealer index is above its medium-term horizontal.
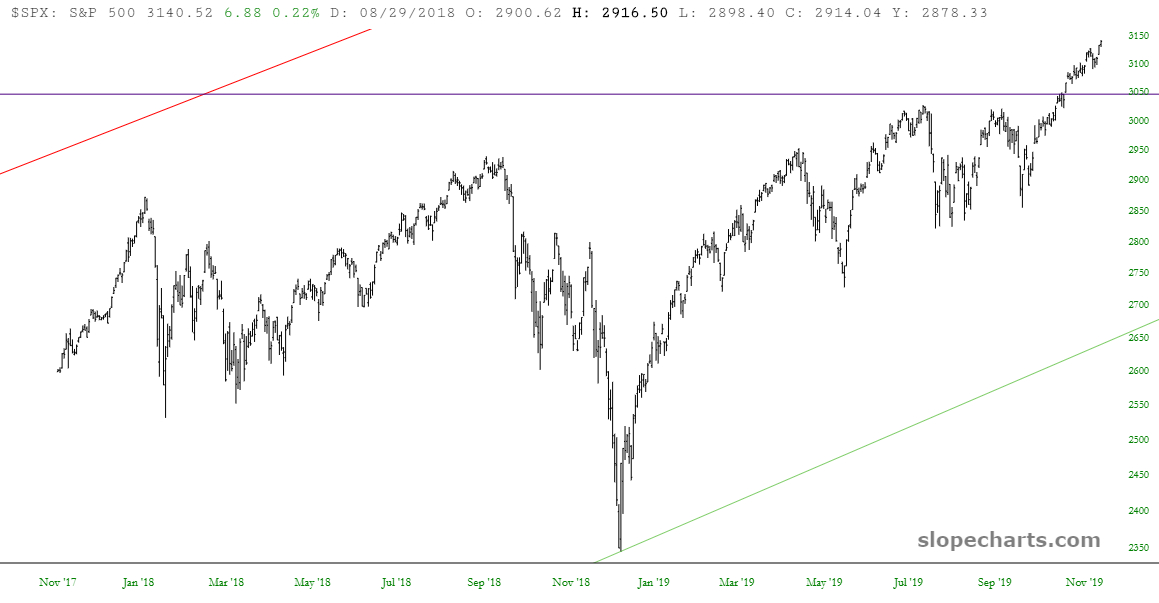
Just about the only thing that should give the government-supported welfare queens known as Equity Bulls any hesitation is the volatility index. It has been hammered down to the 11 level, just about the lowest it has gone in years, and its %R oversold indicator is lower than ever. We all know how massive the short position in VIX is right now, so should this thing catch fire, a lot of welfare queens are going to get badly burned. And it couldn’t happen to a nicer bunch.