
Like I said a few months ago, we need to sometimes check under the hood of the ETFs to understand where things could possibly be turning. In addition, we may be able to find some opportunities to find sector leaders for whatever direction we are looking for the broad market. I have focused on the big FAANG stocks (I expanded this to include TSLA and MSFT as well). I am pointing out some potential entries and targets for these in this bear market.
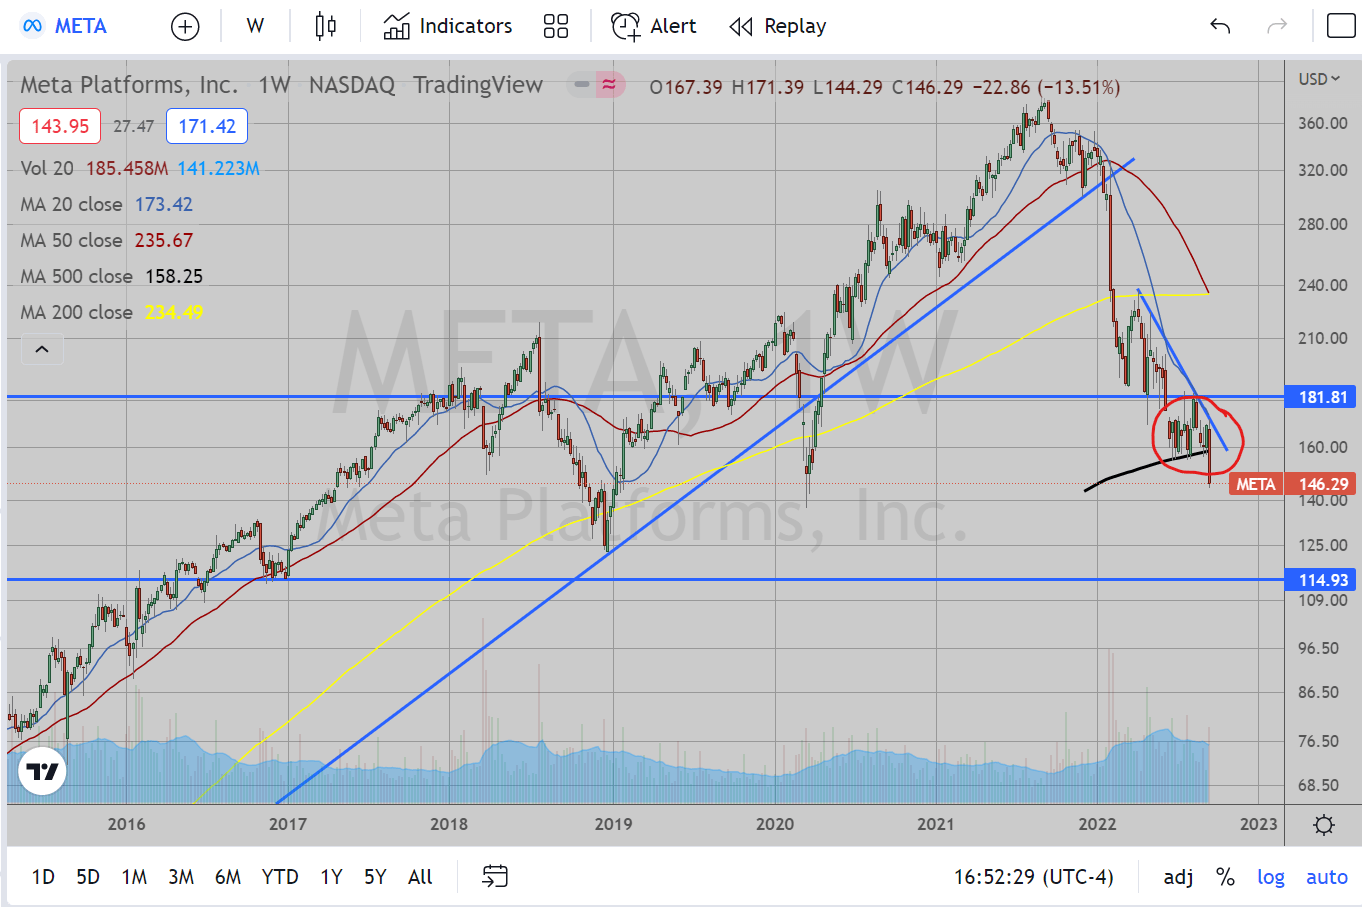
I am starting off with the weakest looking chart. META has fallen far from grace already and does not look like it wants to stop. It is difficult to measure a true target for this one as it looks like it is below several key technical indicators already. The breakdown beneath 155 was huge as this was support since June. At this point, you could look for potential targets using previous bounces, such as 140, 125 and 115. I think the strength of this breakdown can take it down to 100, though, considering this is leading the way down in this bear market. This, of course, is just my way of saying “who knows how far”. I’d look for bearish short term setups that may lead to continuing downward movements.
This is the next most bearish setup. This past week’s action successfully broke down beneath a weekly trendline starting back to June 2016. The first potential target I see is the 200 week EMA at 215. The next I see is for the 50 month EMA around 206 (not shown), followed finally by a trendline dating back to 1987 (second point August 2015 and third point June 2016) around 190.
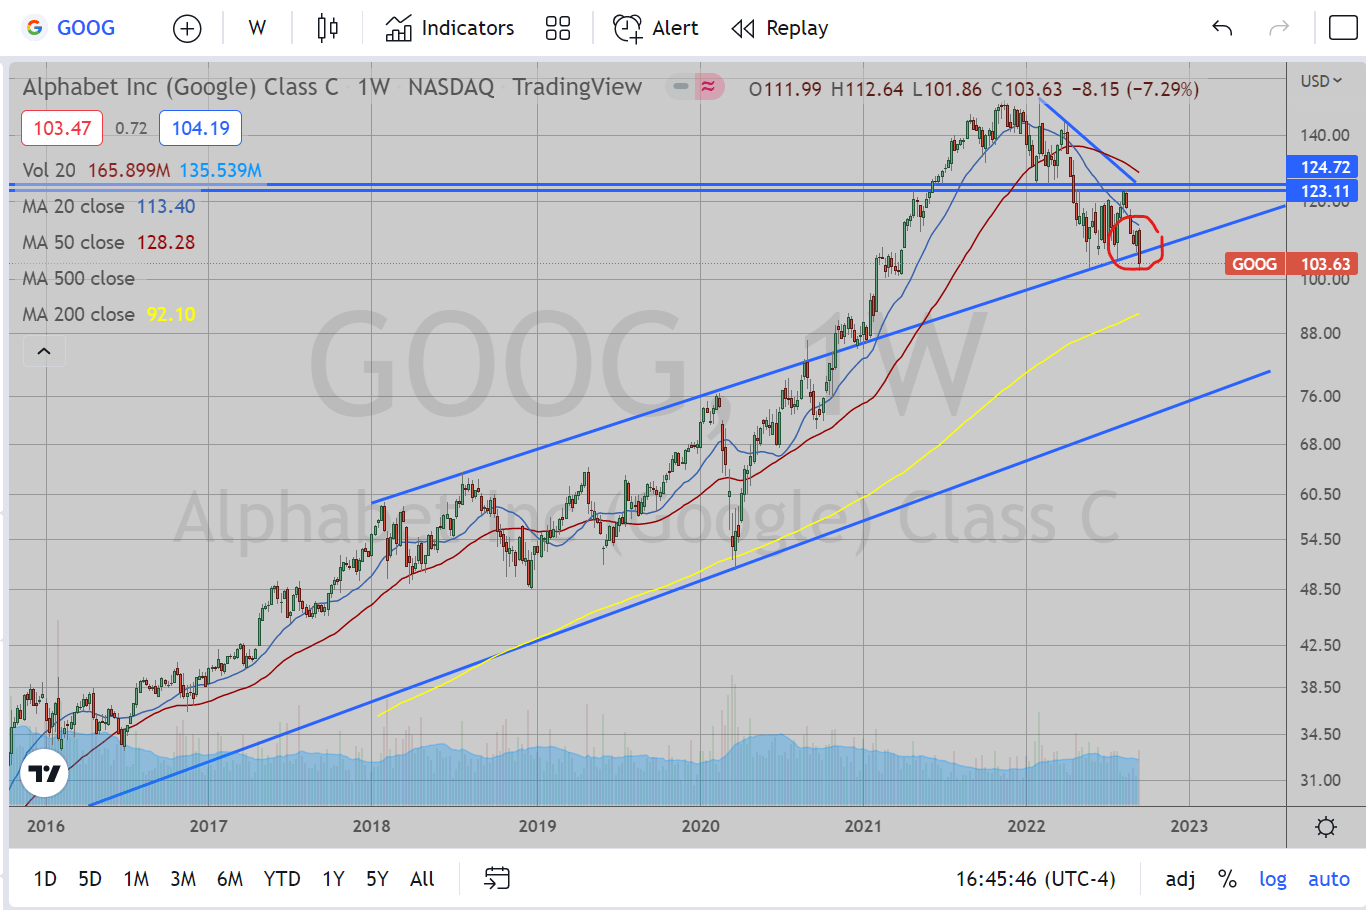
This chart is interesting as this stock shows a bit of a long channel, with the top end of the channel from the peak in 2018 and acted as channel resistance through 2020 until it broke up November of 2020. The bottom of the channel starts from the bottom in May/June 2015 with the second point at the COVID bear market lows in March 2020. This past week, GOOG broke back down beneath the upper trendline of this channel. Potential targets/bounce spots are the 200 week EMA at 92, the breakout level when this first broke out of the channel at 85, or finally nearing the bottom trendline of this channel between 73 and 76. However, the counter-argument would be that this just hit that big round number $100 support which has acted as support since February 2021.
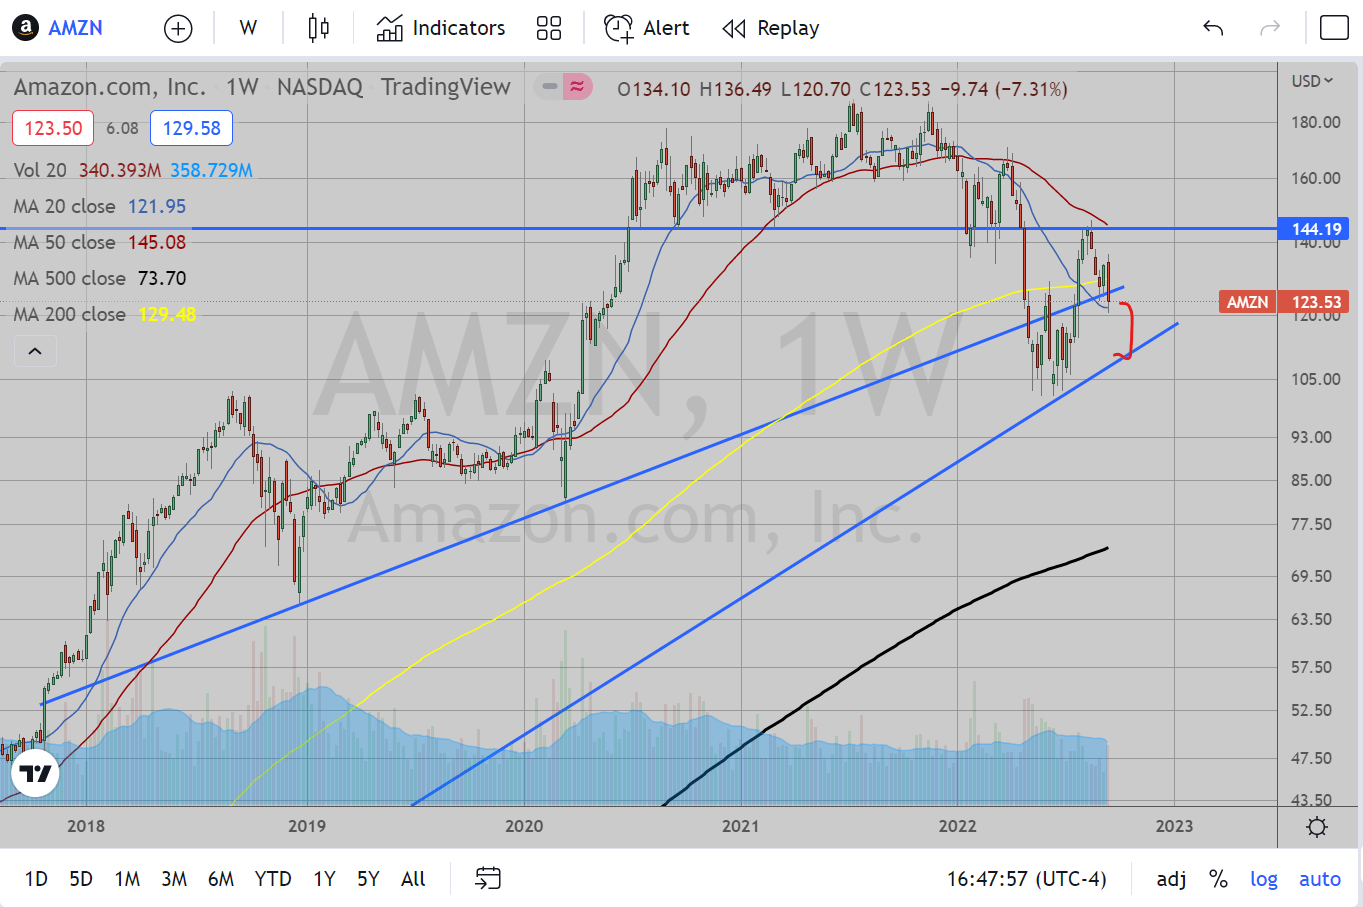
This broke down through a supportive trendline dating back to December 2018, second point in March 2020. The second trendline just beneath this level dates back to 1997, showing support in September 2001, November 2008 (traded slightly beneath), and finally most recently June 2022. A break beneath this trendline would be quite devastating. Much like META, there would not be much technical support beneath here as it would already be beneath most technical levels. So initial target would be the trendline around 107, next supportive level at around 80 (support from February 2019 through March 2020). The next Moving average support is way down at 45 (the 200 month EMA), but let’s round this up to 50.
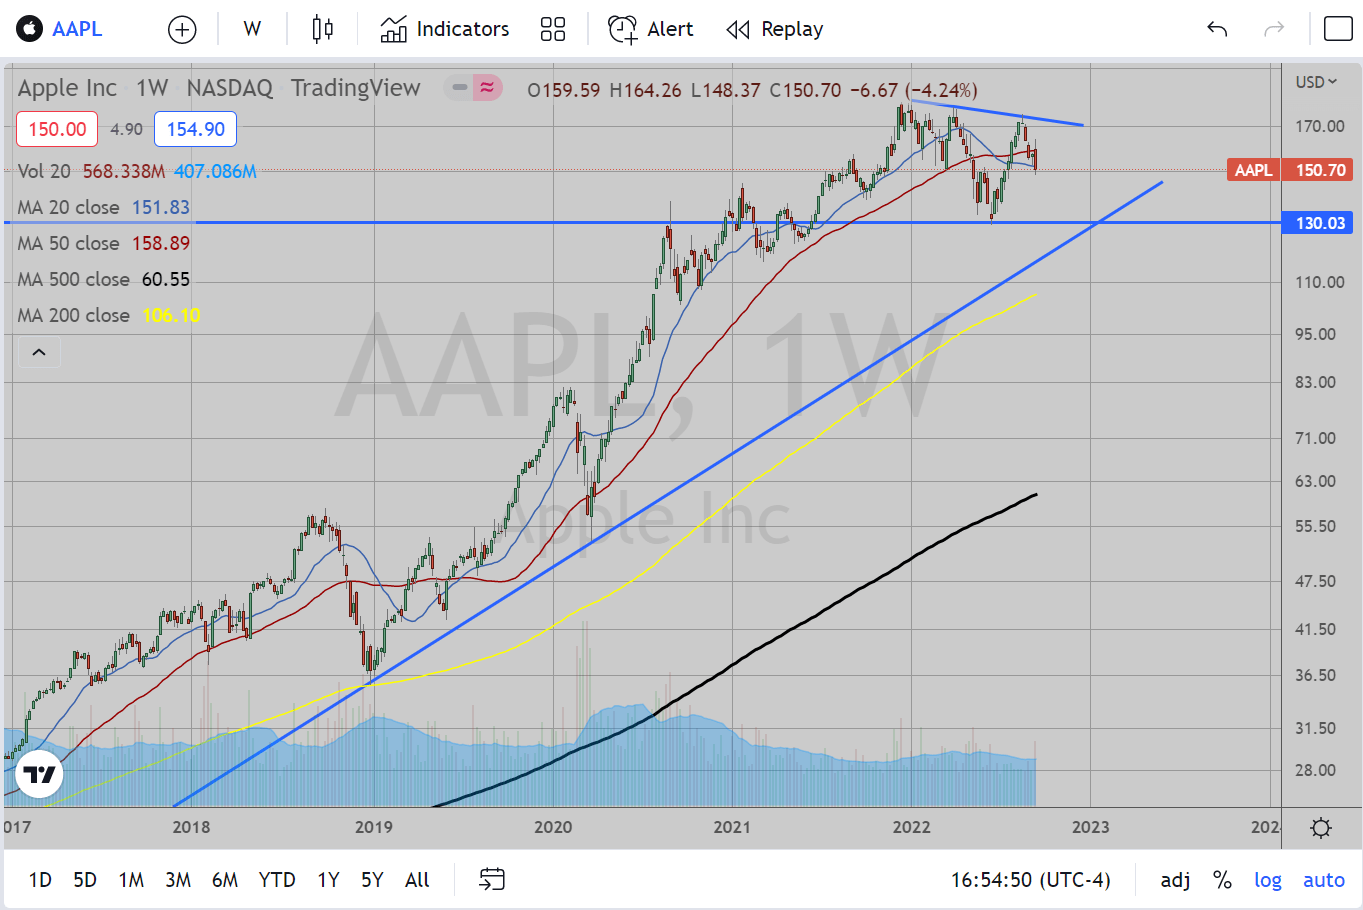
This successfully rejected the descending trendline last month and has actually been a bit weaker than other FAANG stocks since that rejection. It is already AT the 20 Month EMA and 20 week EMA around here. To be more bullish on this it would have to bounce from here. Otherwise, short term bearish targets are the June breakout level at 140, June lows around 130, and finally the 200 week EMA currently at 106. There is also an ascending trendline drawn from lows in April 2003, second point in December 2018 lows, with a 3rd touch during the COVID bear market lows in March 2020. If this stock continues its weak action, I can see it hitting that 130 target and hopefully a bit lower. I’d look at that trendline as a great target to not only take profits but even get a little long. A break of that trendline would be bad news indeed for longer term investors. We shall cross that bridge when we come to it.

As Tim’s post from Friday indicated, this showed support most recently in June at an ascending trendline dating back to 2003. This is attempting a break up through the 20 week EMA and while it pulled back with the rest of the market since the August peak, it has showed strong support since then and is still trying to push back up. However, this needs to break out above that August resistance to consider this completely bullish (i.e., if this is bullish, prove it). Otherwise, I am looking at this as simply a strong stock in a weakening overall bear market. If this is truly bullish, potential targets could be as high as 330 (open gap on Daily chart from April earnings).
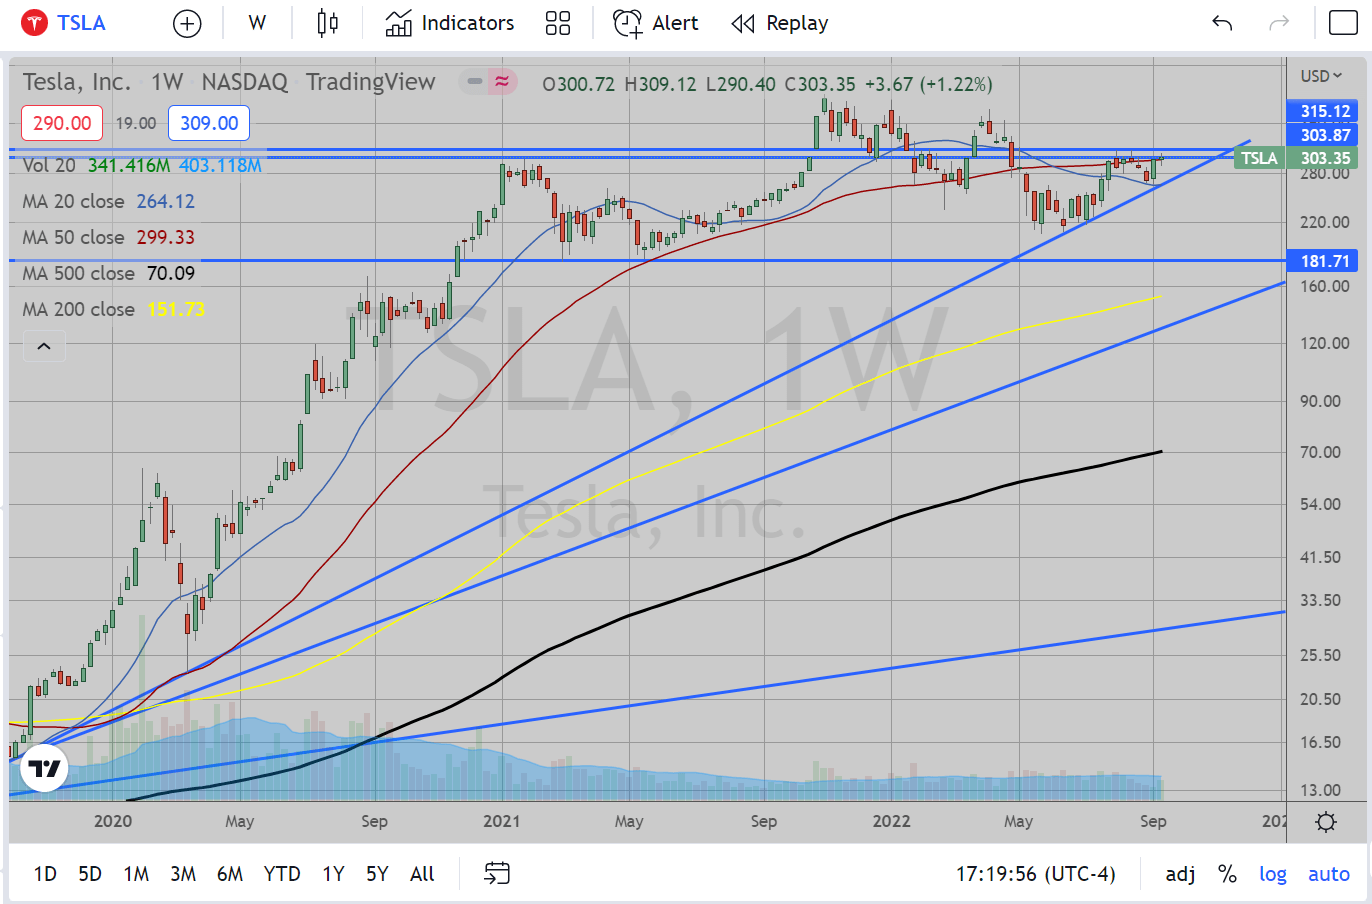
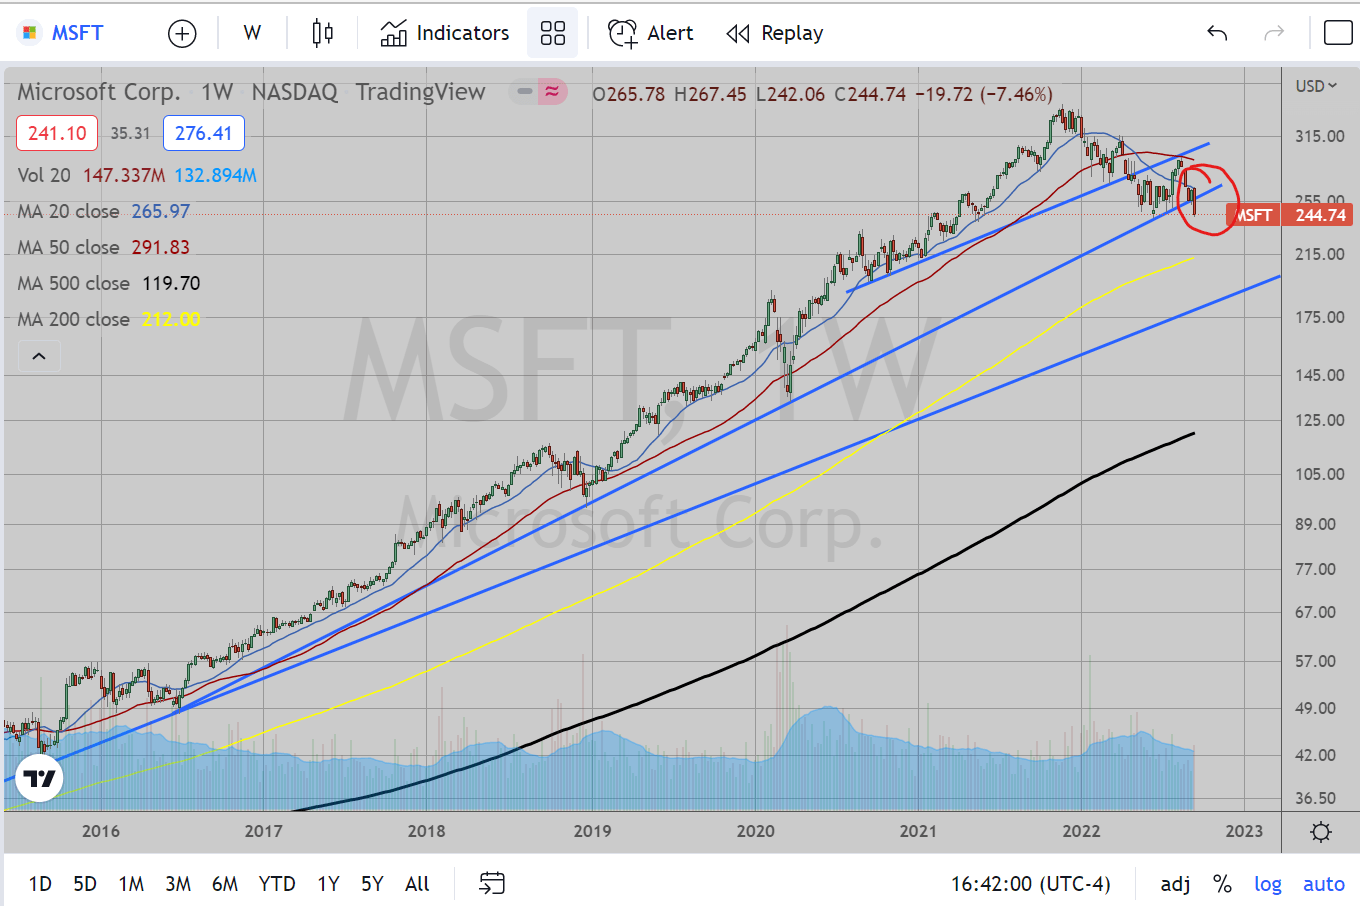
This has been a frustrating short. It seemed to have such potential when the market was dropping until the June lows, when the Bulls came pouring back into this stock. And since then, this is looking quite bullish. The support in June was at an ascending trendline from September 2019 with second point at the lows of March 2020. In addition, support was found at the 20 week EMA at the end of August and this has bounced since then back into resistance at 303. While this traded above this level several days during the week, it still has not successfully closed the week above this level. I still think this could be a successful short, but you may have to give it some room up to 315. A break up above this level could yield bullish targets as high as 340-360 at the descending trendline from the peak in November 2021. However, a successful rejection here would yield an easy target of 265. A subsequent breakdown beneath 265 level (and thus the ascending trendline) would open up possibility of testing 210 (support from June) or even 180 (support between March and May 2021). Last technical support could possibly be found at the 200 week EMA around 150).
At this point I am stressing how I handle my bias. We are in a bear market. If you have ever heard the market proverb “A rising tide lifts all boats”, well that goes the other way too. A bear market is a sinking tide. While some stocks will manage to be stronger than others, even they may not withstand a full assault in a bearish market environment (key word “may”). As such, I approach most of the stocks I watch with that bearish bias, looking for resistance levels. If they begin setting up for bullish moves, they’ll have to prove it to me first before I remove my bearish bias on that stock. As such, for NFLX and TSLA, I’m looking at those potential breakout levels as resistance until they prove they can break up AND retest to continue upwards. So as long as the broad market indices continues on their bearish path, I’ll be watching the resistance to hold.
