
Before you take my head off, I am well aware that for any trading strategy, they say having a bias is a profit killer. But what I’m referring to is how I develop a directional bias for each trade. The reason I need a directional bias is because at the end of the day, trading is inherently biased. Every time you buy, you are bullishly biased. You expect your purchase to appreciate in value. Vice versa for shorting. The big question that would affect your disposition is fundamentals and timeframe.
As with all my posts, I am going to speak from my own perspective and how I take this into account in my own trade plan. Some of you may disagree wholeheartedly, and that is fine. But I hope you learn something that helps you in development of your own trading plan.
How I developed my current trade:
I admit that between 2009 and 2011 I maintained my bearish bias. This was obviously wrong. I basically stayed out of the market since then with a few select long positions (bullish bias) for short time frames. I found that I was not good at trading bullishly (something I am still working on for the eventual bounce). But a bull market is what was available at the time. How do you switch your bias at appropriate times? In the course of the past 11 years there were two big things missing before I could change my overall bias back to bearish. First, I needed to see a true change in the market landscape.
I needed to hear of some true fundamental shift that would signal that things were not only overvalued (as that was evident for the entire duration of the 2010’s), but that things literally CANNOT continue. Throughout the last decade, there were many signs that things were getting out of hand (e.g., the constant printing, the seemingly endless stock buybacks, and most recently the emergence of SPACS and NFTS, etc.). But the market did not seem to care about the risk and there was no end in sight. The second item then missing was actual market reactions turning. For example, while the COVID drop was a shock to the market, the endless promise of additional QE pushed everything right back up. Other news always seemed to have a “Bad news is good, Good news is great” type of reaction. That needed to change.
By November 2021 I was starting to be convinced that a turn was on the horizon. First, we were at peak employment for a while, several years really (this is a very subjective interpretation on my part of the reported unemployment rate). If you exclude COVID, you can see that we were arguably overaccommodative since early to mid 2010’s.
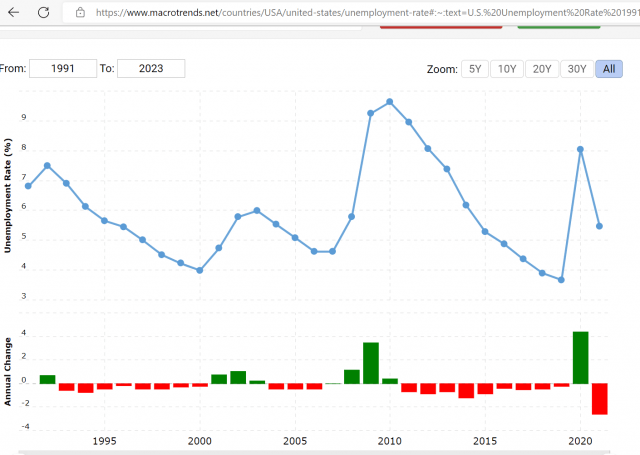
News of the worst inflation in 40 years was just announced as well.
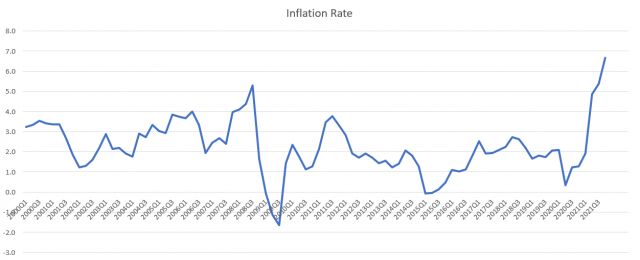
Finally, in mid-December, the Fed declared the official end to Quantitative Easing in response to inflation.
Why were these developments important? As I described above, the news that I was waiting for needed to be a sign that things cannot possibly continue on their current path. With money printing constantly bidding the market up for so long, news of the highest inflation combined with continued low unemployment, and the Fed declaring a that free money was to be no longer, I felt that the fundamental sands were finally shifting.
This was an early indicator for me. But what about the second item? Well, the market still did not seem to be appropriately reactive yet. I admit that I did try to short the market in November on these two data points, but this was the reaction I saw:
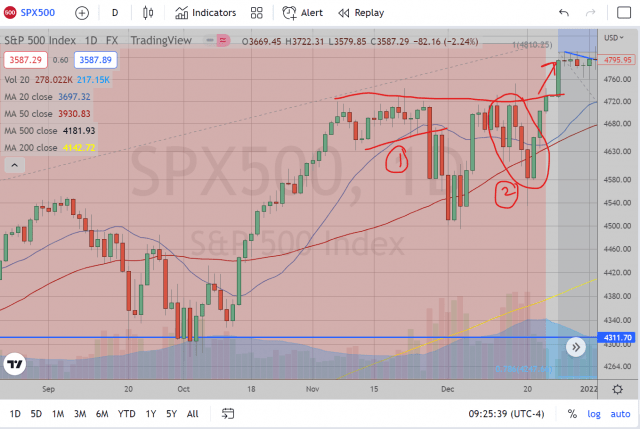
The continued bullishness was frustrating to say the least. But then January came and the last puzzle piece final came to fit.
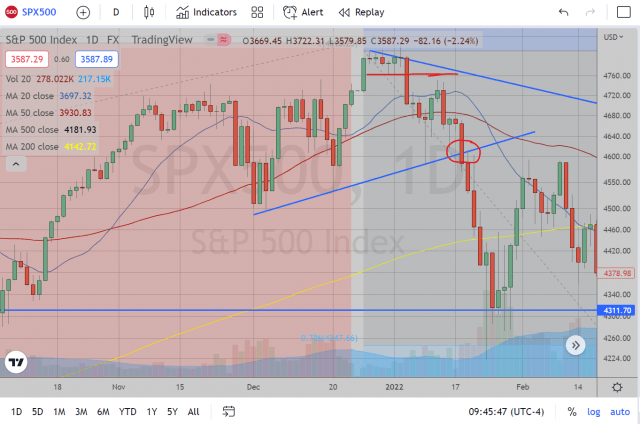
The headlines in early January were COVID related, but nothing major that we hadn’t seen before. Yet, the market, for the first time in a long time, had seemed to react quite negatively to what had previously been a nonevent. Then, continued weakness and a technical break on the daily chart with no major new was starting to make a compelling argument that things were now shifting.
That was a long intro, but it was the most important in determining the appropriate bias for my trade plan.
This brings me to the next phase of my trade: technical setups. Since I now have a directional bias to the downside, I was looking for the long term charts (monthly) and look for technical setups for continued downside. The January month breakdown beneath 4600 was very telling. When I saw that January was engulfing the previous month’s candle and closing beneath it, I started to look for technical setups for good shorts on weekly and daily timeframes.
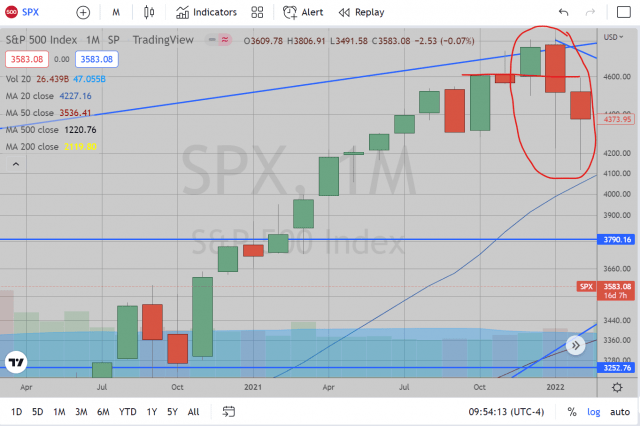
As long as the monthly chart continues to look bearish, I will continue to look for weekly and daily bearish setups. Note that I mentioned the monthly set up in my “Moving Averages” post in August was still set up quite bearishly despite the large August rally.
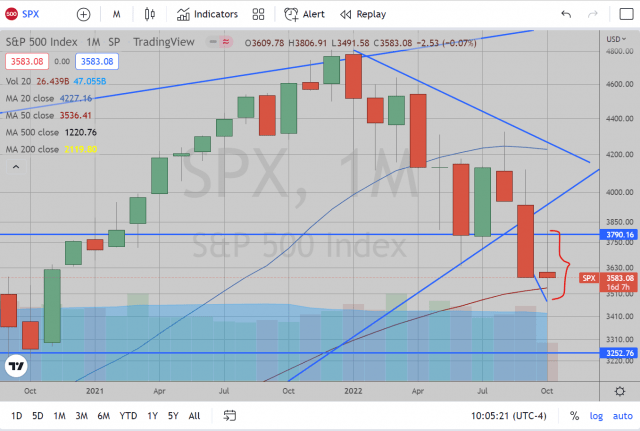
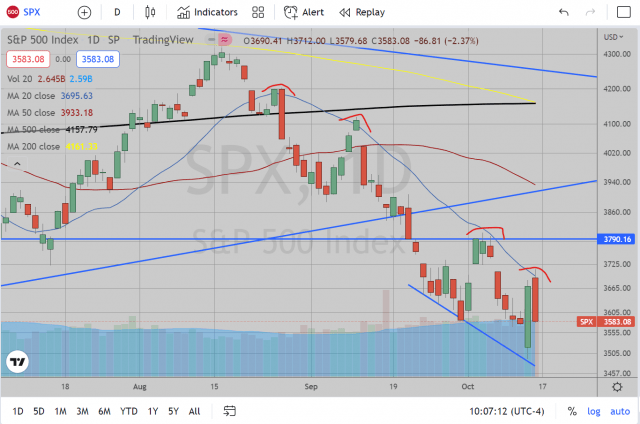
Extending this to the current market charts, the monthly looks weak but indecisive (there is still 11 trading days left in the month which we could continue to fall), weekly looks bearish (engulfing red week even in the face of 200 week EMA), and daily looks bearish (continued rejection of 20 day EMA).
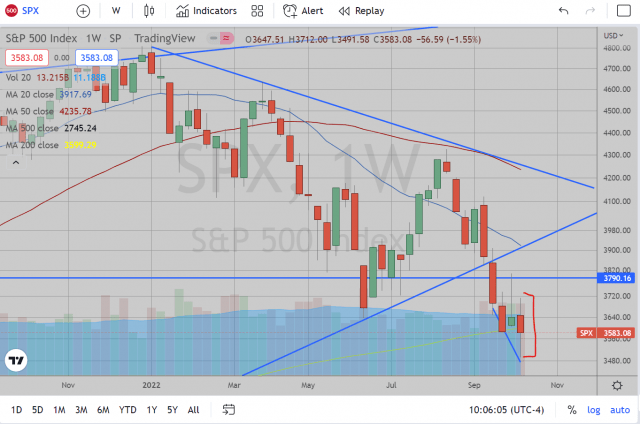
I want to emphasize that while we are hitting the 200 week EMA, some may argue that it is time to bounce. I would note here that look at all technical indicators as markers or signs, not necessarily hard and fast walls. The price action is what determines the move. If the market wants to drop then it will do so regardless of the technical indicators in its way. And so far, this 200 week EMA saw the attempted bounce in the first week of October and it still wanted to fall this past week.
With that, as long as I see the smallest time frame still working, I’ll be holding onto my short positions. As we approach my targets, I am moving stops down based on the smaller and smaller time frames in case things want to break back up. What I mean by this is that as we approach the earliest of my targets, the more willing I am to close out a position at the smallest indicator of a potential reversal. In contrast, I would not rely on these smaller time frames near the beginning of my trade.
Now, some of you may disagree with this type of trade plan. This is just what works for me. Certainly, if you are capable of trading nimbly you could possibly extend these suggestions to shorter time frames (e.g., if you are day trading, set up the daily charts as your “long term” basis for your bias, then set up your 4Hour and hourly, or even 15 minute charts looking for technical setups). Furthermore, your fundamental bias could be based on other market forces, for example the currency or bond markets (I am not as good at this as some others here). But it must be clear that a certain bias is necessary when trading as you pick a side, so to speak. Your trade plan will need to include your entry and exit plans such as I laid out mine for you here.
