
Note from Tim: be sure to check out the prior post, which has a very important announcement. I did not want to get in the way of Xerxes’ contribution, below, so on with the show……….
While there has been no shortage of astonishing and frustrating market action in the past 12 months in both directions, I am of the mind that this market is ready to break down. As with most things in Technical Analysis, the power of 20/20 hindsight is our biggest strength (ironically). Now that we see how we got to where we are at, we can make an assumption as to the future path. From what I have seen, the next month’s actions should make a deterministic move in either direction.
As I have stated in the past, Moving Averages are one of my favorite technical indicators. While I do use Trendlines as a basis for decent entry (if they hold) or exits (if they break), the moving average can provide an indication of general market bias, the most simplistic interpretation being “Above the average = bullish sentiment, below the average = bearish).
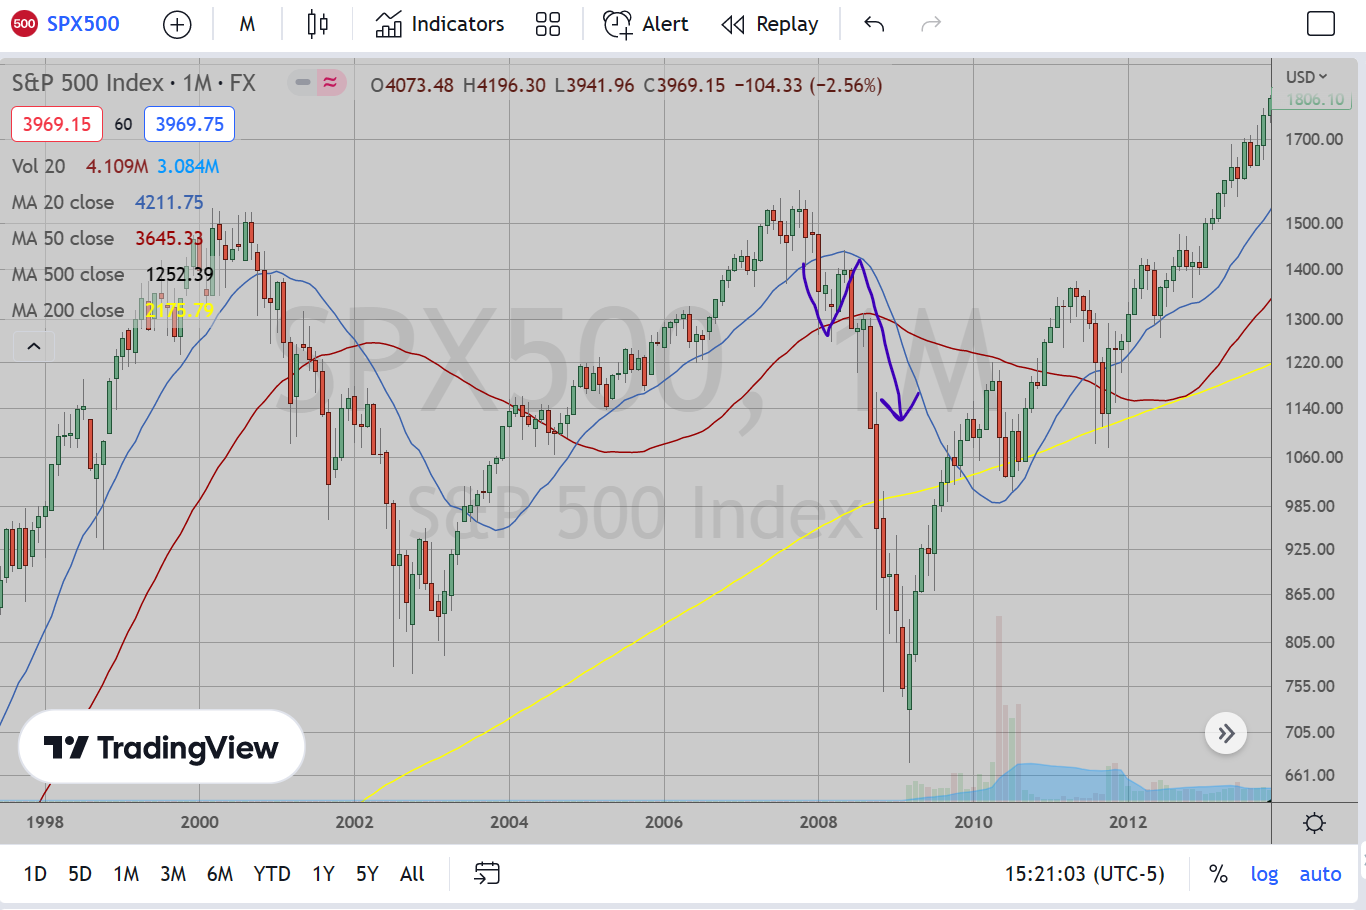
The Moving Average crossover is an important tell as this can mean a change in the sentiment while rejection (i.e., failure to cross) can be a doubling down of continuing sentiment. This pattern is noticeable on a few very specific occasions in the past on the monthly chart. The most recent was 2008 as shown in the chart above. We had broken down to beneath the 20 Month Moving Average in January 2008, test the 50 Month MA in March and even bounce all the way back up to retest the 20 Month MA from underneath in May which, when rejected, led to a large downdraft to finally break beneath the 50 Month MA (and it wasn’t even the largest leg down of the bear market that year as that didn’t begin until September that year). Measuring the peak of this rejection to the ultimate bear market low, the total downdraft from that peak was about 53.7% (1440.24 peak in May 2008 to market low of 666.79 in March 2009).
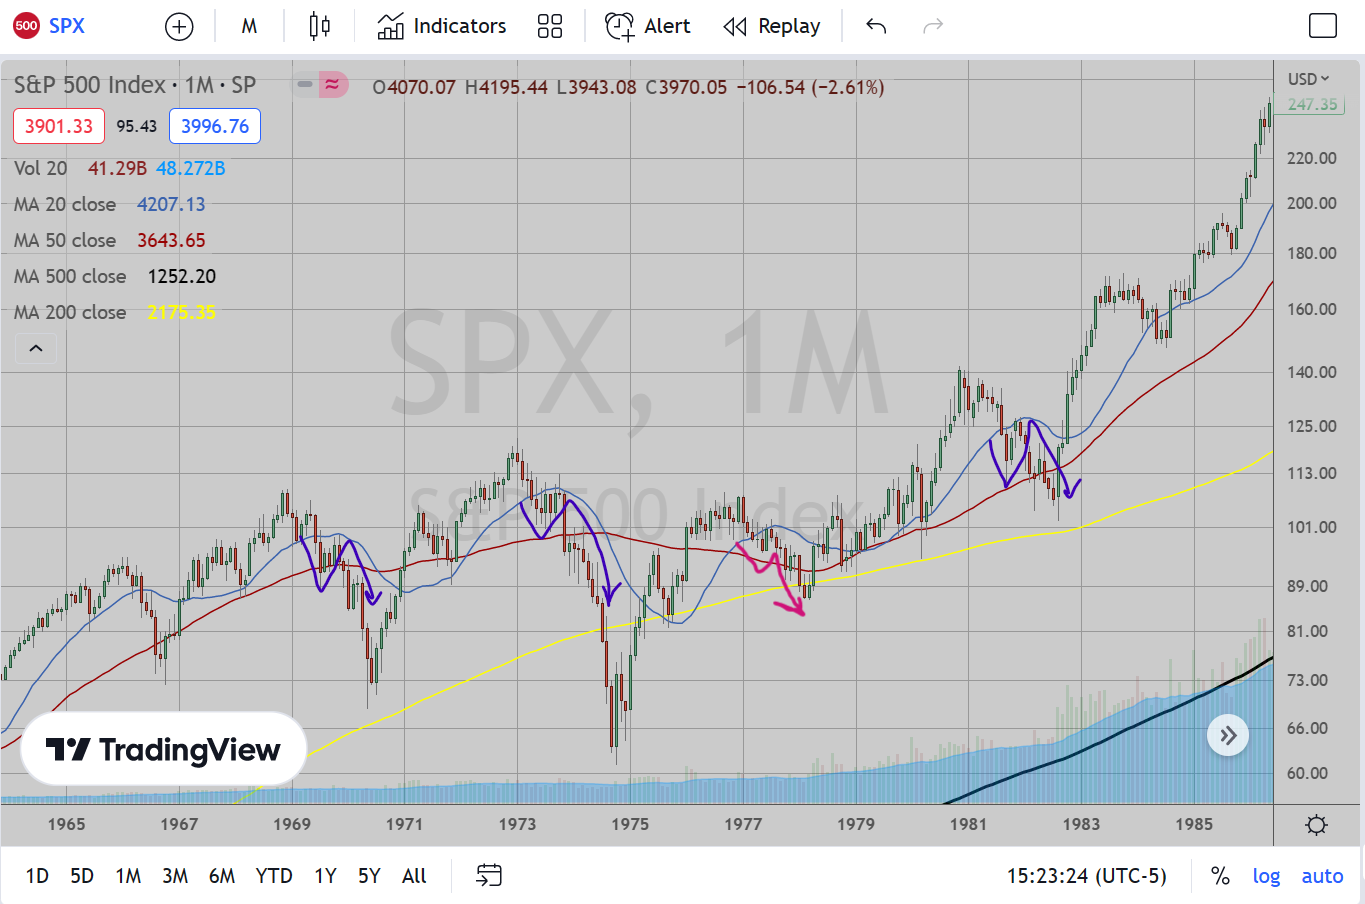
Prior to 2008, the last time we saw this pattern was 1981 (after which the subsequent downturn is the shallowest of the examples I put forth here, but was a significant downturn nonetheless of 19.7% from that rejection peak). Prior to that were 1973 and 1969, with downdrafts of 46% and 30.9% respectively. To some extent you can argue 1977 follows this pattern successfully with a 15.7% downdraft.
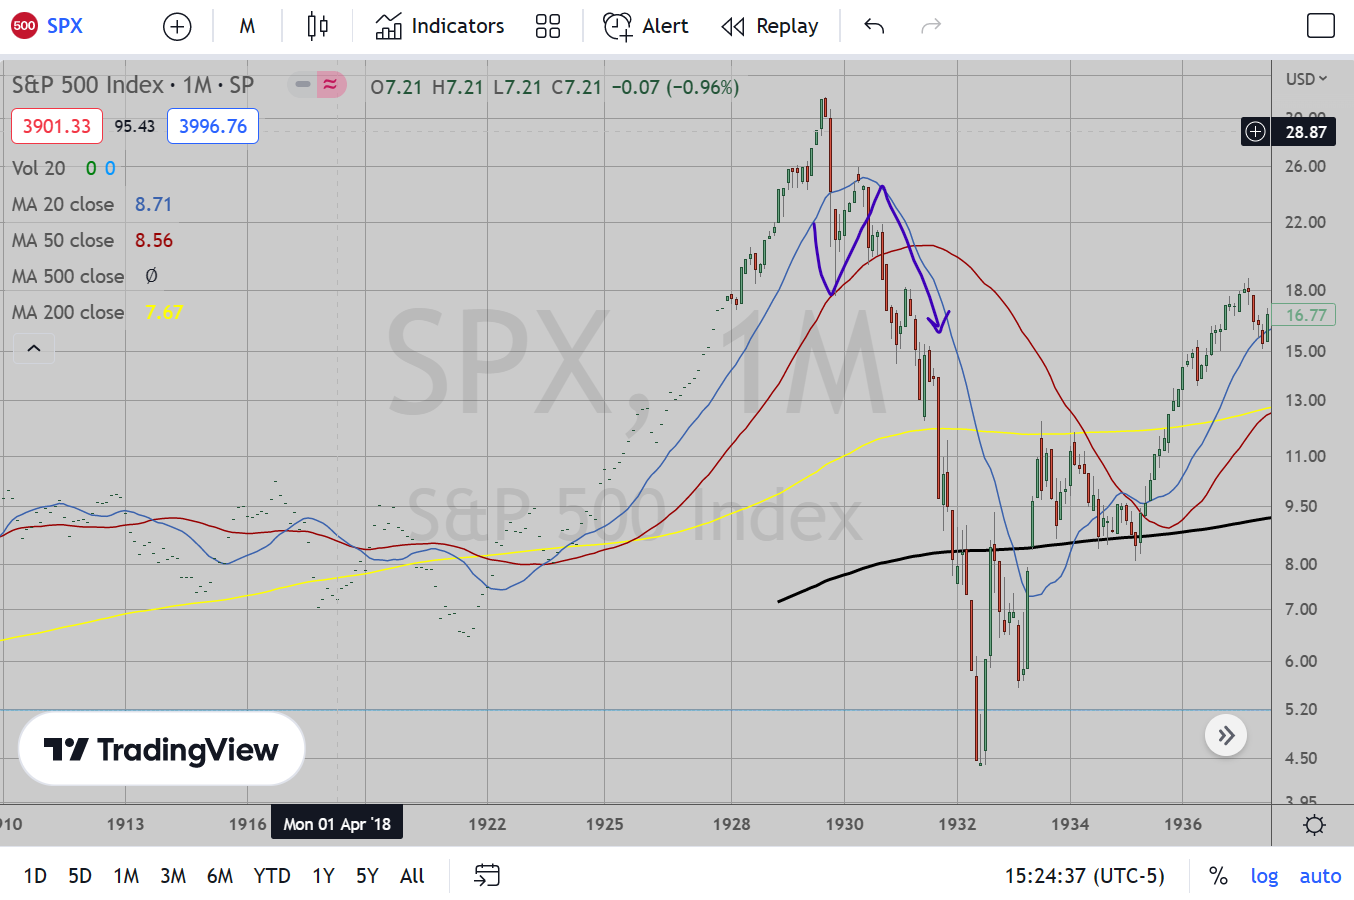
And the last example is the granddaddy of them all, the initial test of the 50 Month MA in November 1929, retest of this average in April 1930 before the largest crash we have seen to date in the stock market with a downdraft of 83% from this rejection.
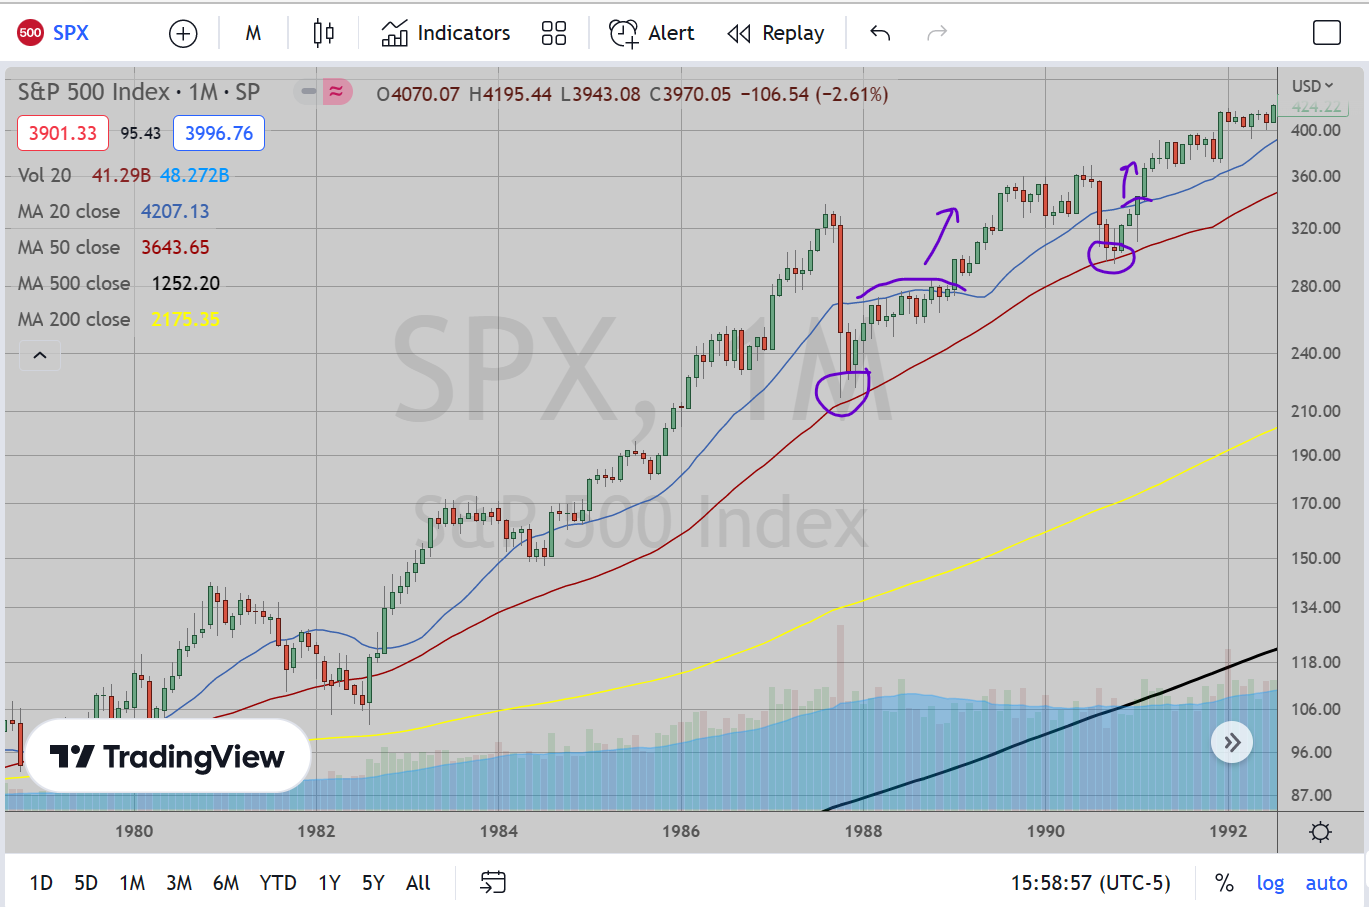
I need to find at least one counterexample as it is always possible that this downdraft doesn’t happen. I found two examples (and only two) in which the 50 Month MA was tested, the 20 Month MA was then retested from underneath with no (or minimal) downdraft before commencing with the next market climb. The first was after the crash in 1987 in which we tested the 50 MA, bounced up to the 20 MA then just traded sideways for a few months before drifting and breaking above this average. The next was in September/October 1990 where we bounced off the 50 MA, then barely held beneath the 20 MA and managed to break above it in January 1991.
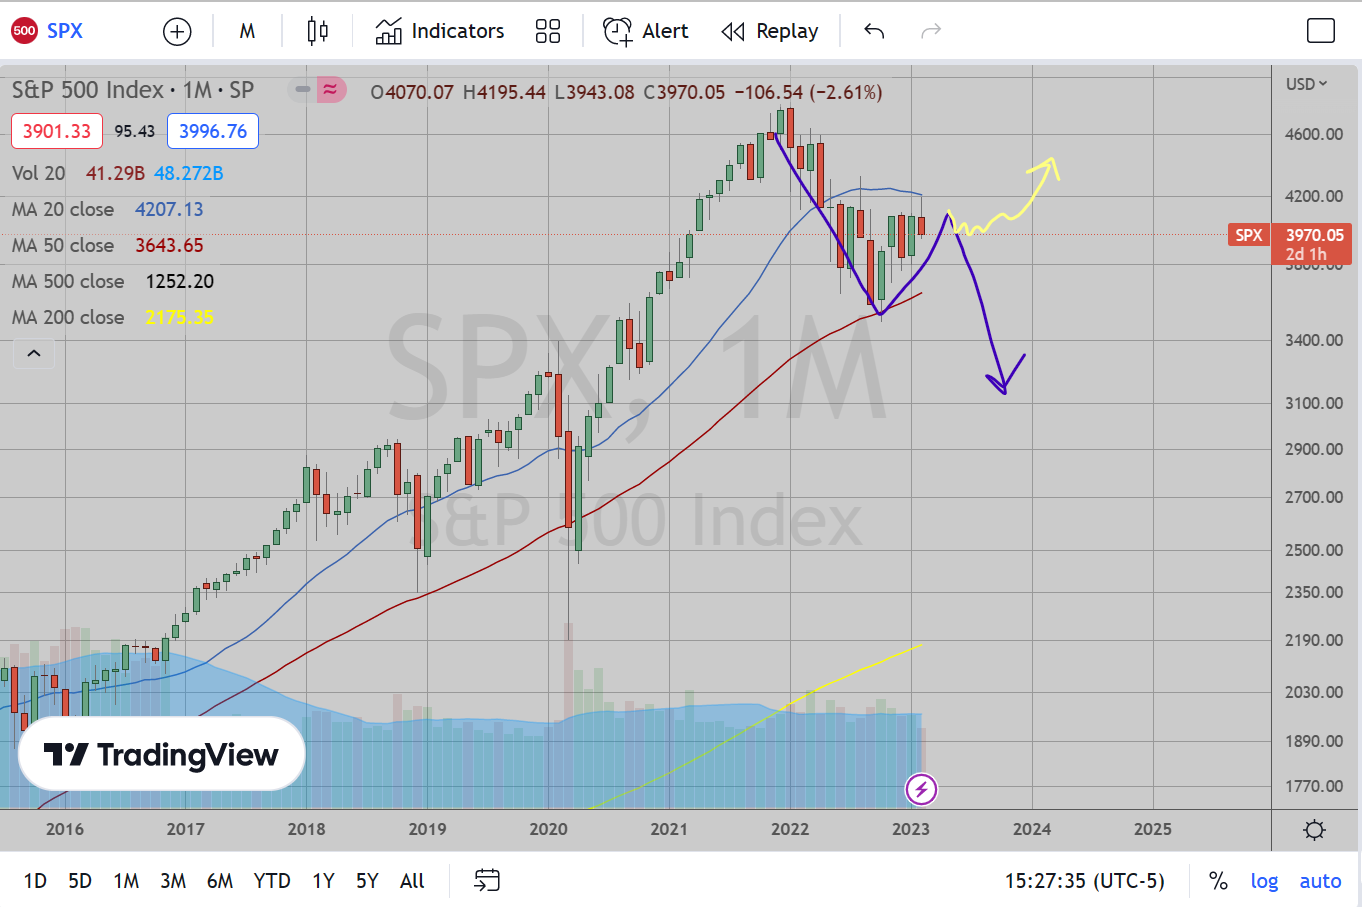
Here we are today. I think what we are seeing here is a very bearish rejection of the 20 Month MA. This average was supportive until April 2022. In May we finally broke down beneath it, found support at the next longer term 50 Month MA at about 3500, then finally came back up to revisit the 20 Month average on Feb 2 peaking at 4196. Given the potential downdrafts we’ve seen, we can make some assumptions for our trade. I am betting on the downdraft to work out (Purple line). If it doesn’t, however, I will find out very shortly that I am wrong and the market will likely melt upwards (Yellow line).
With regards to how I am setting up my trade, I am first setting a stop loss at 4200. If we break above there, the pattern is broken and I am throwing in the towel. This would mark about a 6% increase from where we closed Friday (4200 / 3970 – 1 = 5.8%). However, if using the other successful downdrafts as estimates to develop targets, then the minimum target (using the 1977 pattern) would be about 10.9% downdraft from here (15.7% from recent peak), or about 3530. Ignoring that and using a more weighted average (judgmental weighting), I could aim for anywhere between 2700-3200 (anyone can set up this analysis for themselves and play with the weights. It is all judgmental).
The point is, if even the minimum downdraft occurs, I still have a risk reward ratio of about 1:2 if shorting from here, which is not bad at all). In my base case scenario then, I have a risk:reward ratio upwards of 1:5, which is pretty fantastic.
As always, I want to reiterate my points about all my analyses. While most analysis is based on the question, “where will the market go next?”, the next true question that should matter more to you is “how do I maximize my profit if I am right while minimizing my loss if I am wrong?” This is a very subjective question that can only really be measured by the trader themselves. Nobody truly knows where the market is going next. We can only prognosticate and give our educated guesses. What I am laying out here is my own views on the potential path of the market and how I am going to react given the possible scenarios.
Best of luck to everyone in their trading this week.
