
To see Part One of this post, click here.
In fact it preceded 3 of the last 5 recessions 1982 1990 and 2007. Not a bad start considering that the 2020 recession was a very special one.
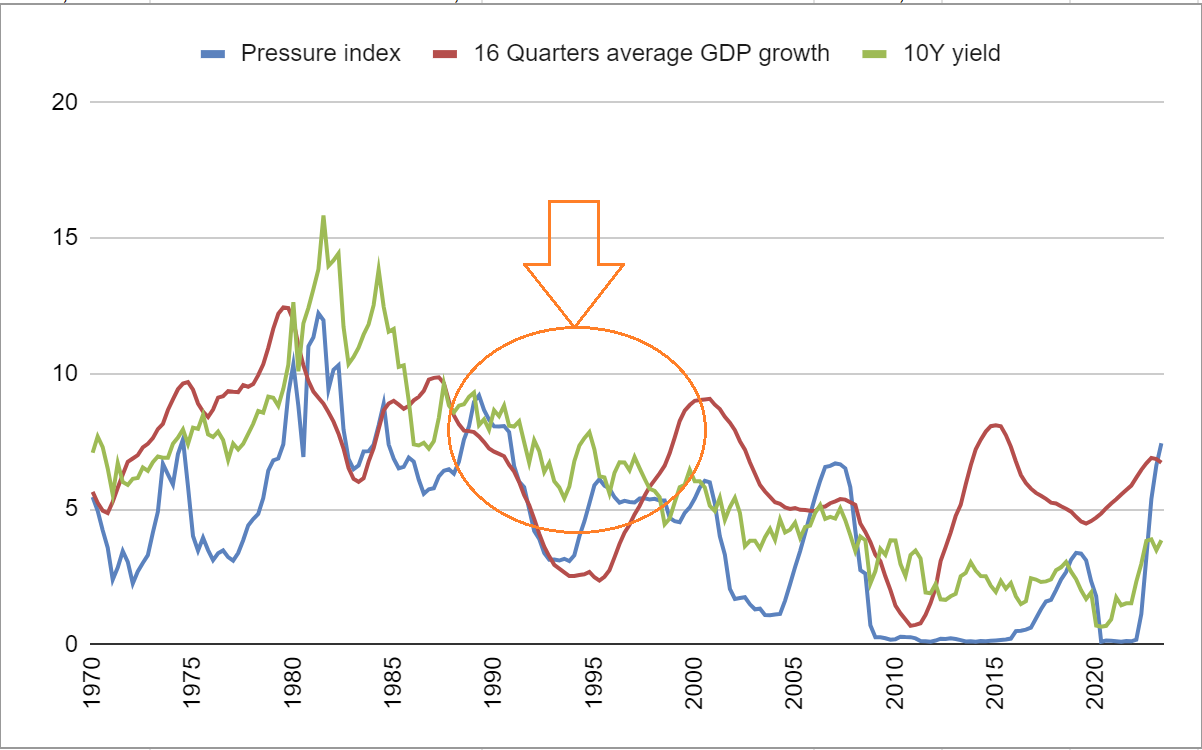
Now even if 1990 was a recession year it can be considered as a soft landing, things ended up really well at that time and there’s another period that you should take a look at: 1994 when Greenspan aggressively raised rates without causing a recession.
When you look at the chart the pressure index was raised well above the red line and for a relatively long period of time, why did we end up in a no-landing scenario?
I’ve tried to wrap my head around it for some time and clearly there’s no shortage of arguments to explain such a strong resilience:
- Federal debt held by private investors to GDP ratio almost half today’s level
source: https://fred.stlouisfed.org/series/HBPIGDQ188S
- Middle class in much better shape than today with plenty of savings
source: https://fred.stlouisfed.org/series/WFRBSN40166
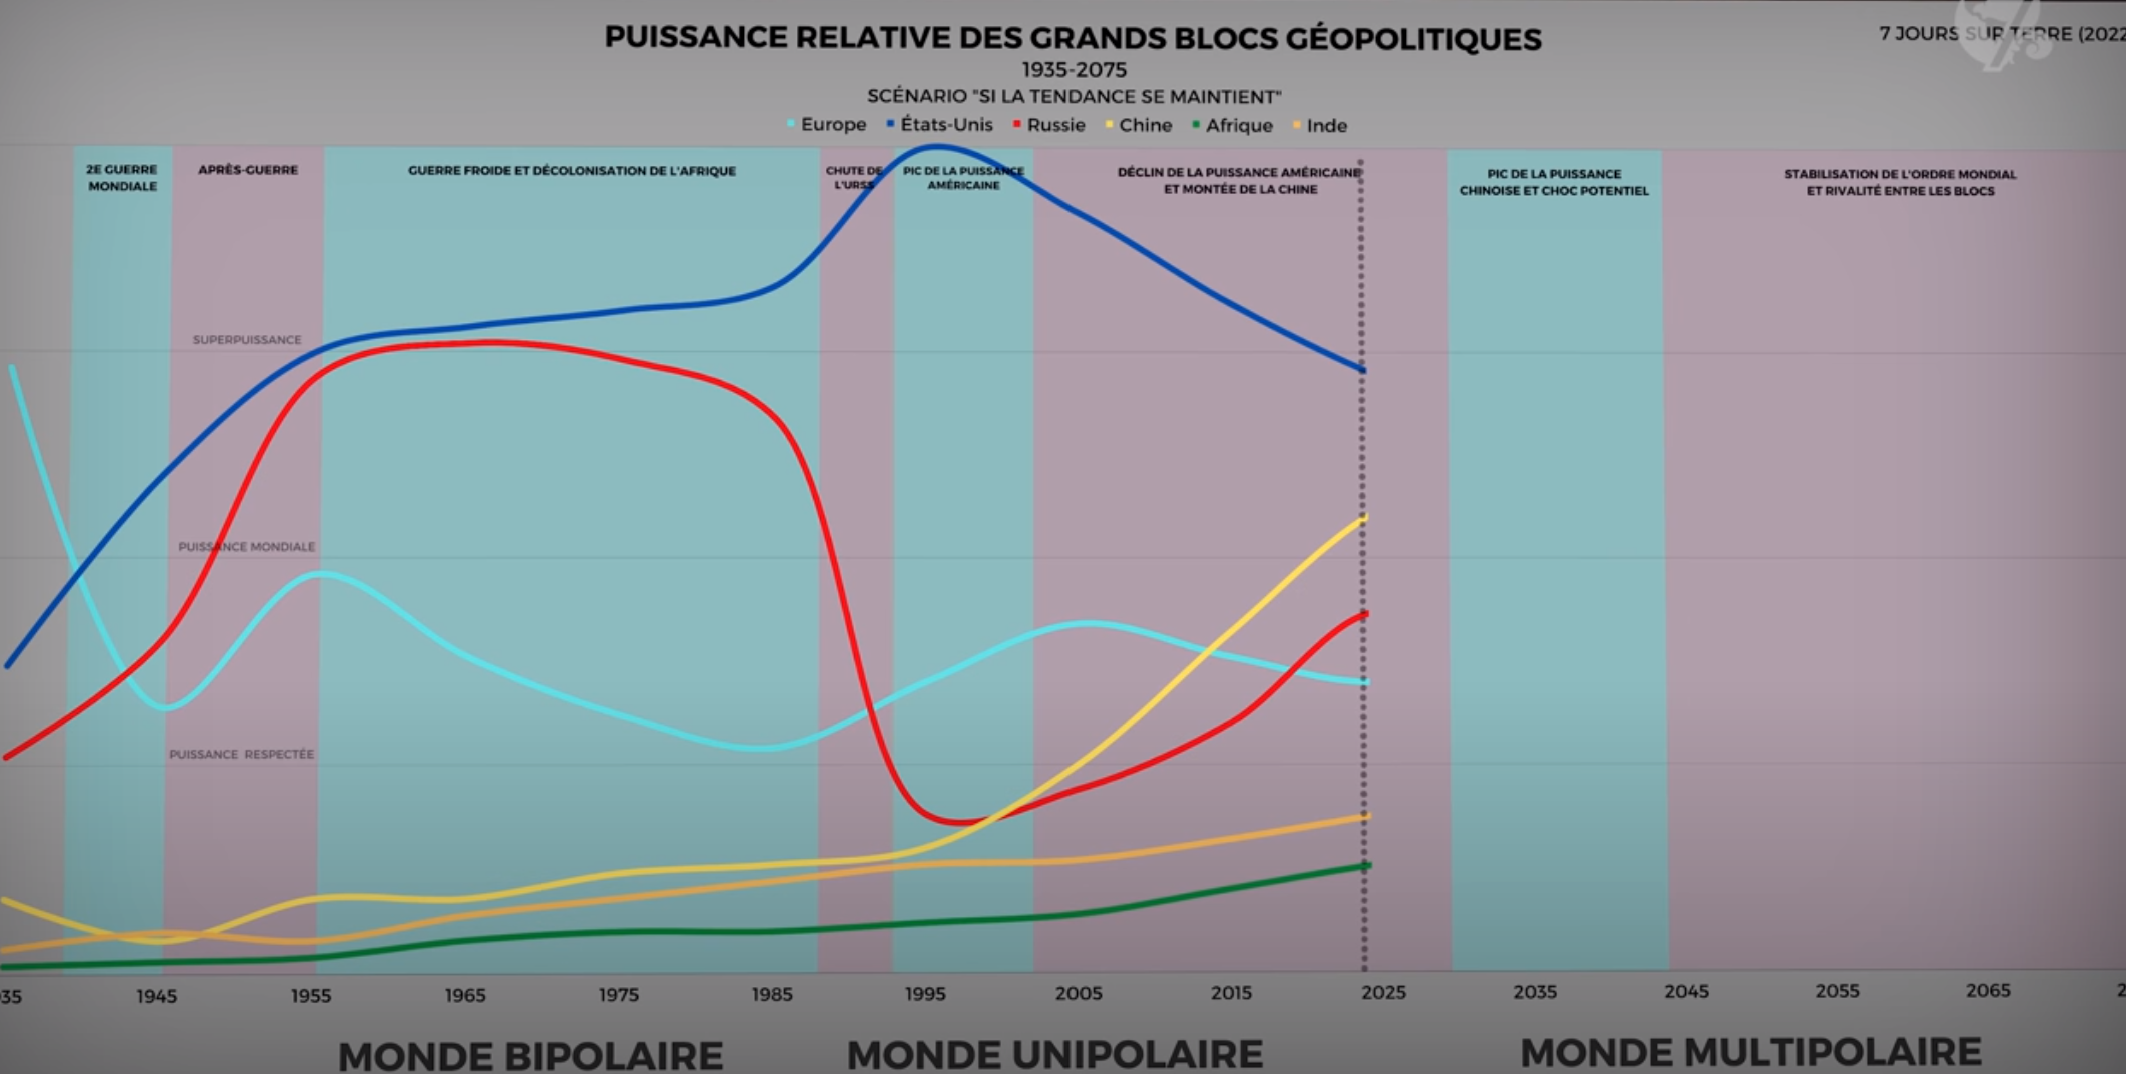
- America literally at its peak influence following the collapse of USSR (as much if not more than during the great Roman empire apogee)
- A low valuation stock market to GDP (still a lot of room to artificially inflate if needed to stimulate growth) source: https://www.visualcapitalist.com/the-buffett-indicator-at-all-time-highs-is-this-cause-for-concern/
- Low real estate valuations (still a lot of room to artificially inflate to stimulate growth)
- Internet revolution in the making although it wasn’t that much obvious at that time
- China/ Emerging economies
All of this was a potential boost and fuel for future growth, and the market knew it better than anyone else, remember that high levels of debt and high interest rates aren’t problematic as long as there’s enough growth to sustain it (also look at post WWII era as an excellent example of that).
But wait……… clearly the market knows better than anyone of us when it comes to forecasting future growth, so I may be able to upgrade my indicator by taking advantage of that.
Ok now I can see that at that time the 10 year yield clearly was telling investors, “don’t panic as long as I’m at such high levels” and he was spectacularly right! 1994-2000 was a great period.
So now I realized that I can combine the knowledge of the market with my indicator, and even better, I can shorten my average of GDP growth (had to do 16 quarters to remove as much noise as possible) because I can create a formula to pick actual growth when it’s above 10Y yield and just use the latter when it’s below.
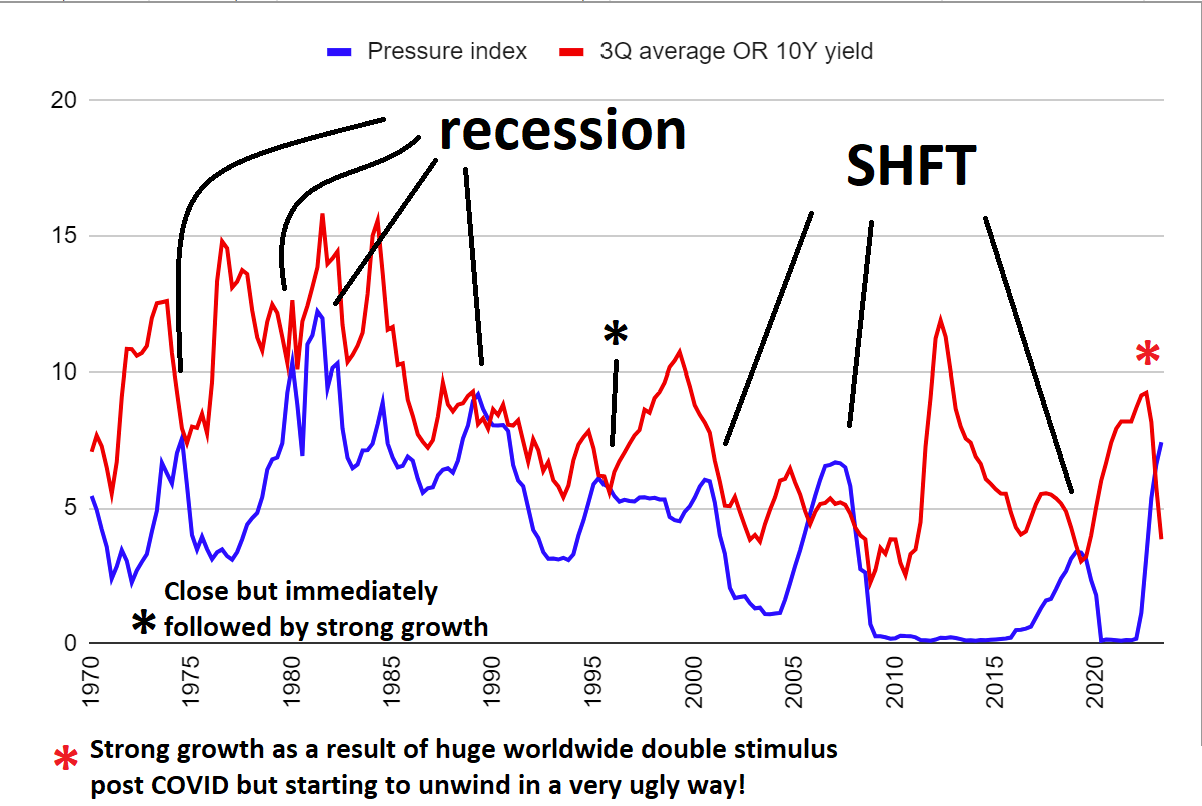
Bingo! Now being able to use a smoothing as low as 3 quarters of “realistic” GDP growth (not public debt driven) I can now have a very good picture that ended not only to sound warning before EVERY recession of the past 40+ years but also a “probabilistic” model of where rates are going to peak.
And today you can see that we are at the highest probability of the last 40+ years to see rates peak. That doesn’t mean that the top is necessarily there. Powell could still be raising rates in July but that would only raise once again the probability of something breaking sending short term yields sharply down like SVB’s collapse a few months ago (the 2Y yield is still below pre SVB’s collapse)
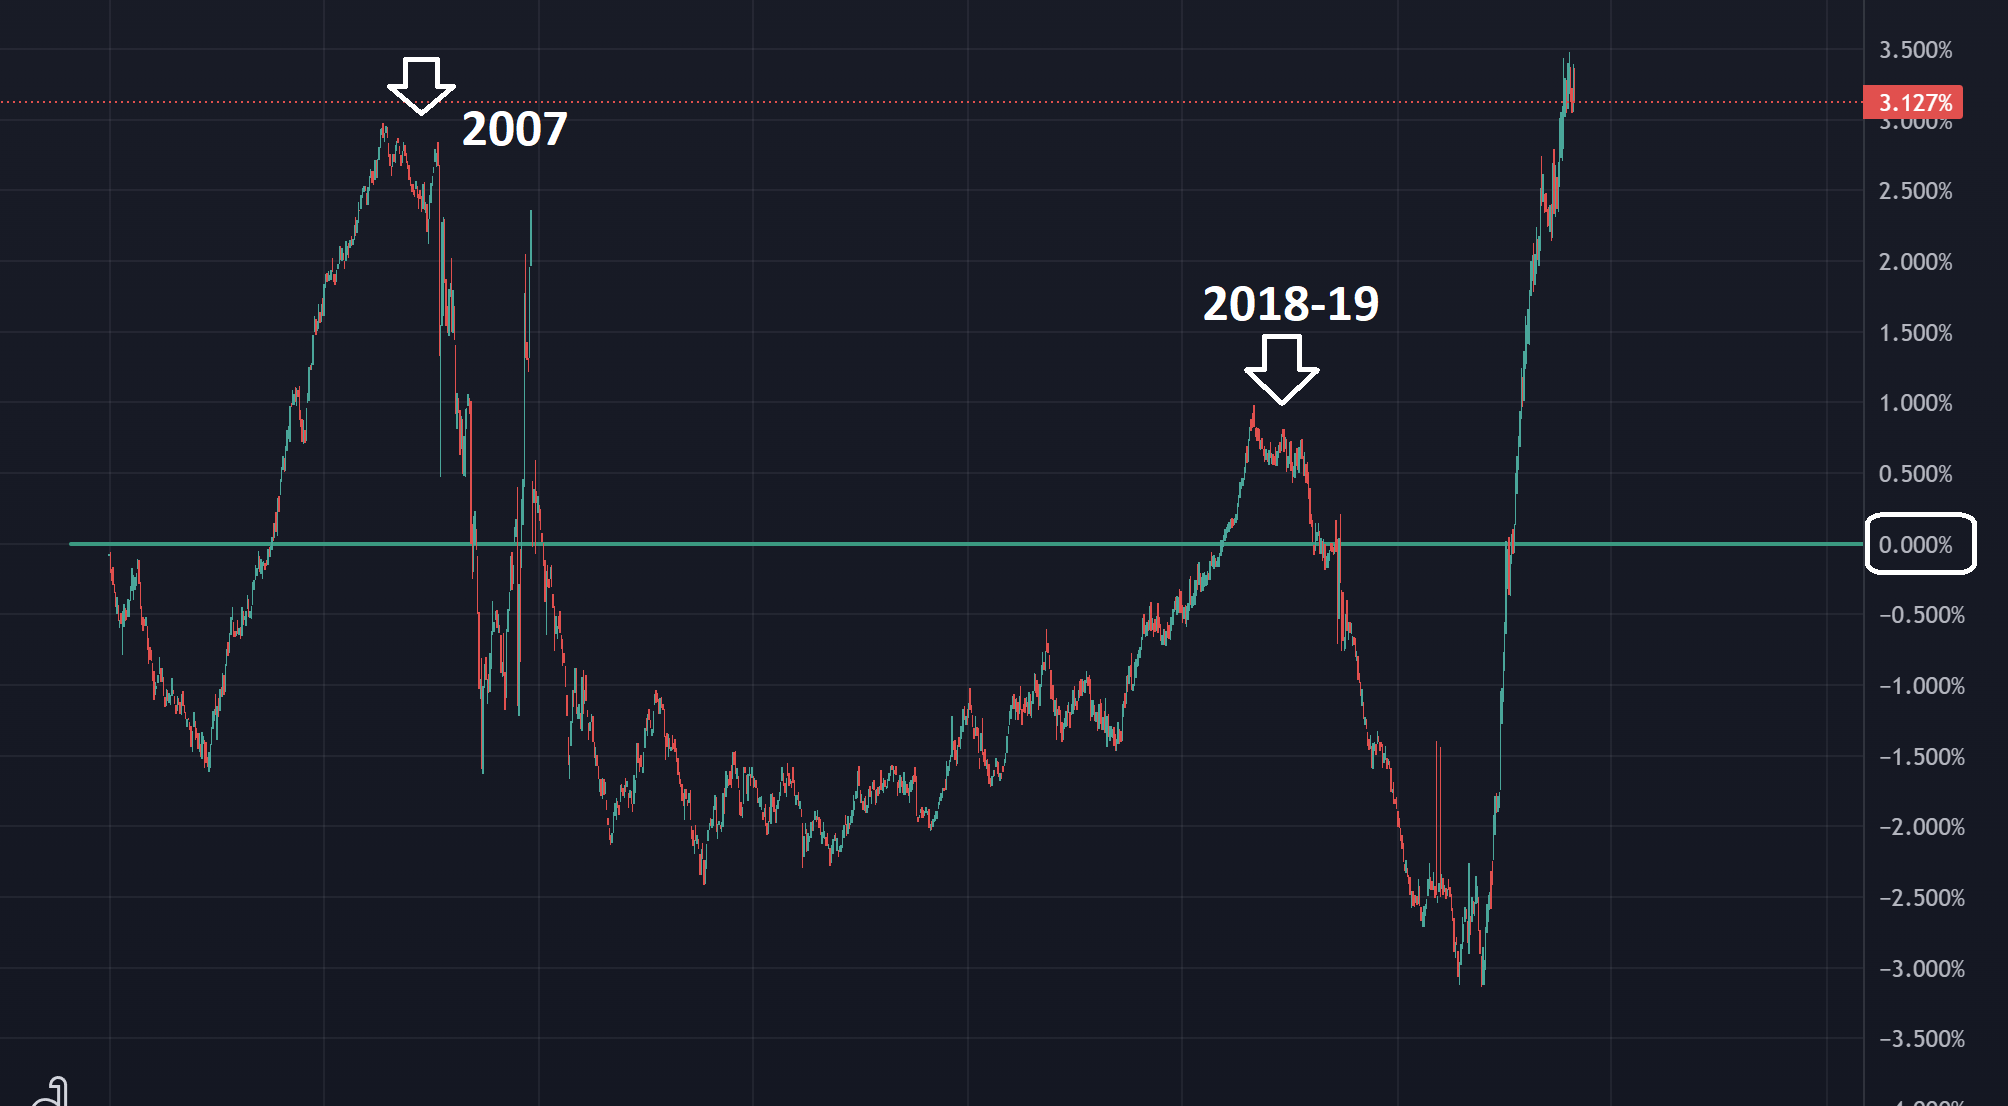
And God forbid that today the 10Y yield doesn’t even seem to hold 4%, clearly not 1994 anymore on that front!
But one thing is clear by looking through this prism: Powell largely exceeded the neutral rate and is in DEEPLY restrictive territory. Something relatively well confirmed by this simple chart (3m yield – 5Y breakeven)
All of this at the same time that traders and investors pile into big tech and long duration/growth stocks. Really incredible!
There’s still a lot to say about that… especially with regards to technicals…….. so more to come I guess!
