
Hi, all! It has been quite a while since I’ve had anything to write. This market is just too bananas for me to trade. The oversized exposure of the market indices to a handful of tech stocks just smells like trouble. While there are a handful of attractive long setups out there, I’ll buy very tentatively and selectively.
Here are the latest stocks I am watching:
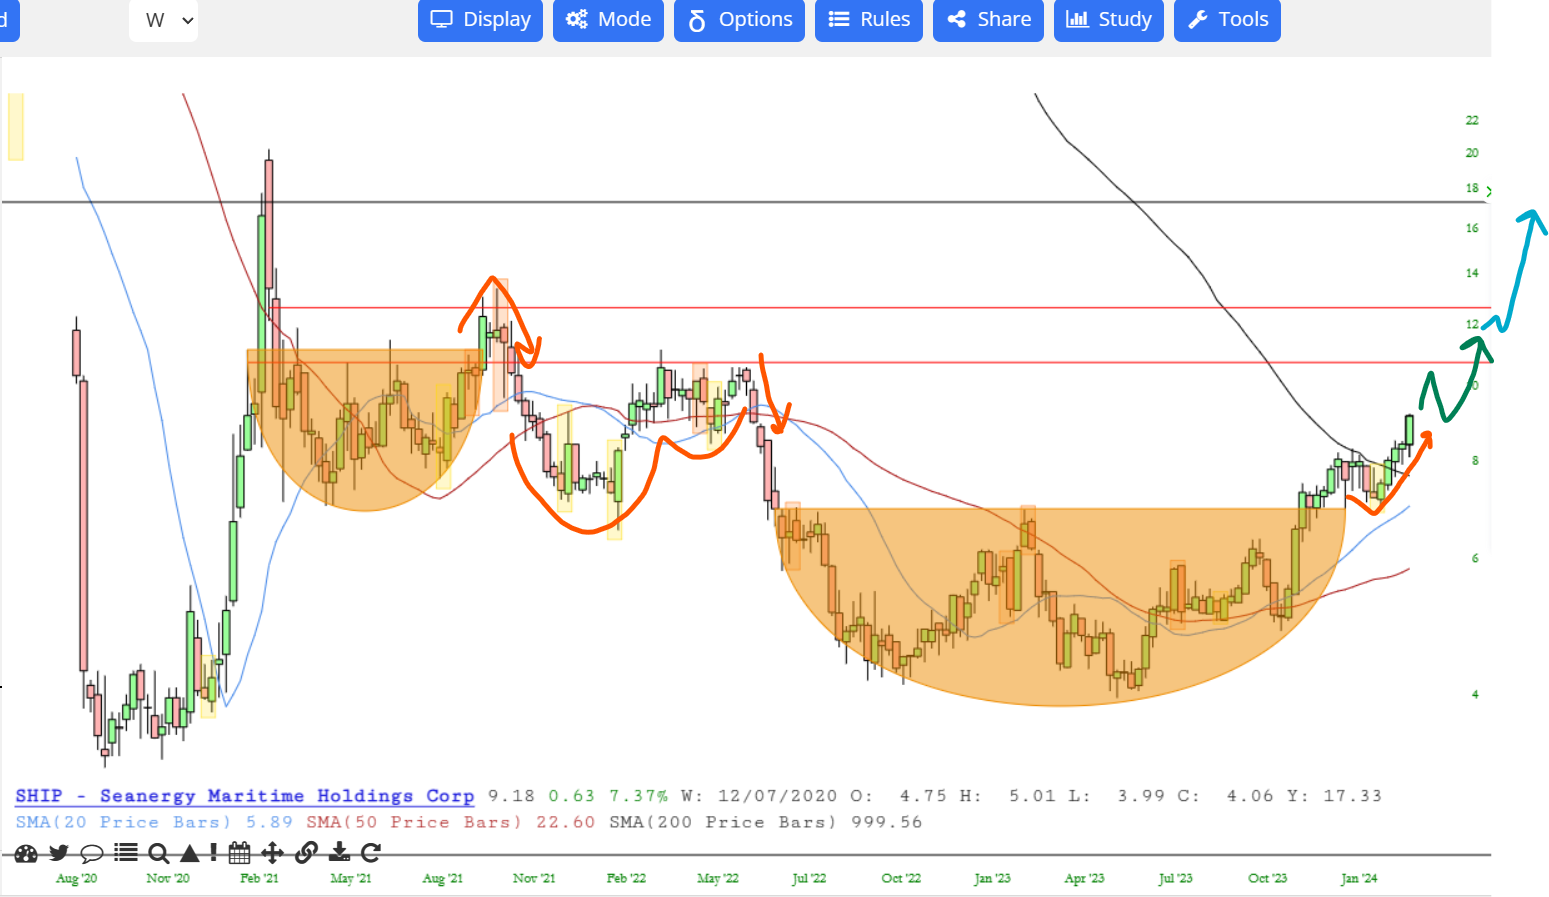
SHIP. I’ve mentioned these shipping stocks about a month ago. While they aren’t taking off, they are slowly but surely moving in the right direction. The pattern is slowly working on this after a long base and breakout attempt. This saw a successful pullback and retest at the $7 level and a push above the breakout peak at about $8.20. Today had quite a nice pop in it as well. I’m looking for the push up to the prior resistance zone of about $11 as the first target.
After that, I’ll move stops up, but plan on holding this for long-term if the basing pattern can hold. I’ll look for the pullback from $11 for some basing and look for secondary target at about $13 where the real long-term test will be. I really don’t know if this gets beyond $13 this year, I’ll have to watch the price action around there. This looks like it had a bounce/bullish attempt to base in the past in 2021. The fact that it is now moving up to retest is a bullish case to at least make another breakout attempt. With the whole sector moving up, I’m thinking this has a chance to be a nice long play for the investment portfolio.
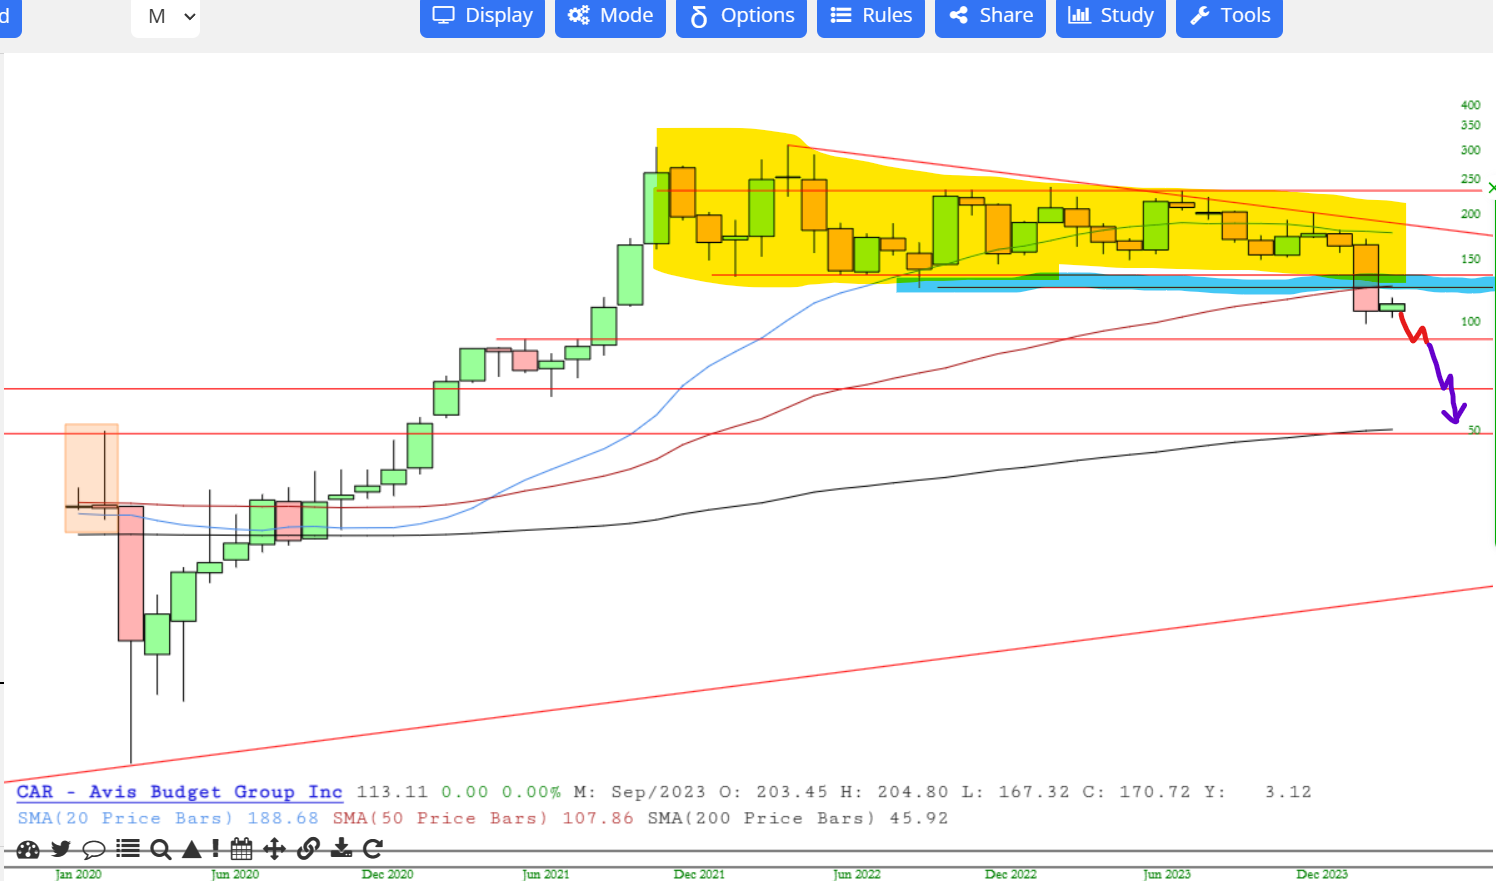
CAR. This is an oldie but goodie. I’ve mentioned this many times before. This essentially had a massive 2-year range top that finally broke down. While this had a fantastic initial move down (tested 100 from 160, a 37% profit to anyone who shorted when I was banging the table on this one! Hope someone caught that move), it is now in the midst of this bounce attempt, but I feel like this will be a deadcat bounce.
ANY move up towards that blue tinted zone is highly shortable with a close stop above 130 area. However, I think if we start to see a short-term top to form around here in 110-115 zone then that may be the end of the bounce. I.e., while 130 would be mouth-watering to short, don’t hold your breath and maybe take the price in front of you. Why? Because my target on this is ultimately around $50. The next move down initial target is $90, where we might see some support attempt. But given the sharp move down from 160 to 100, I think we may see a similar “no bounce” slice down through $90. Either way, my point is I am looking at this zone to start topping out soon and will have my button at the ready to short this thing.
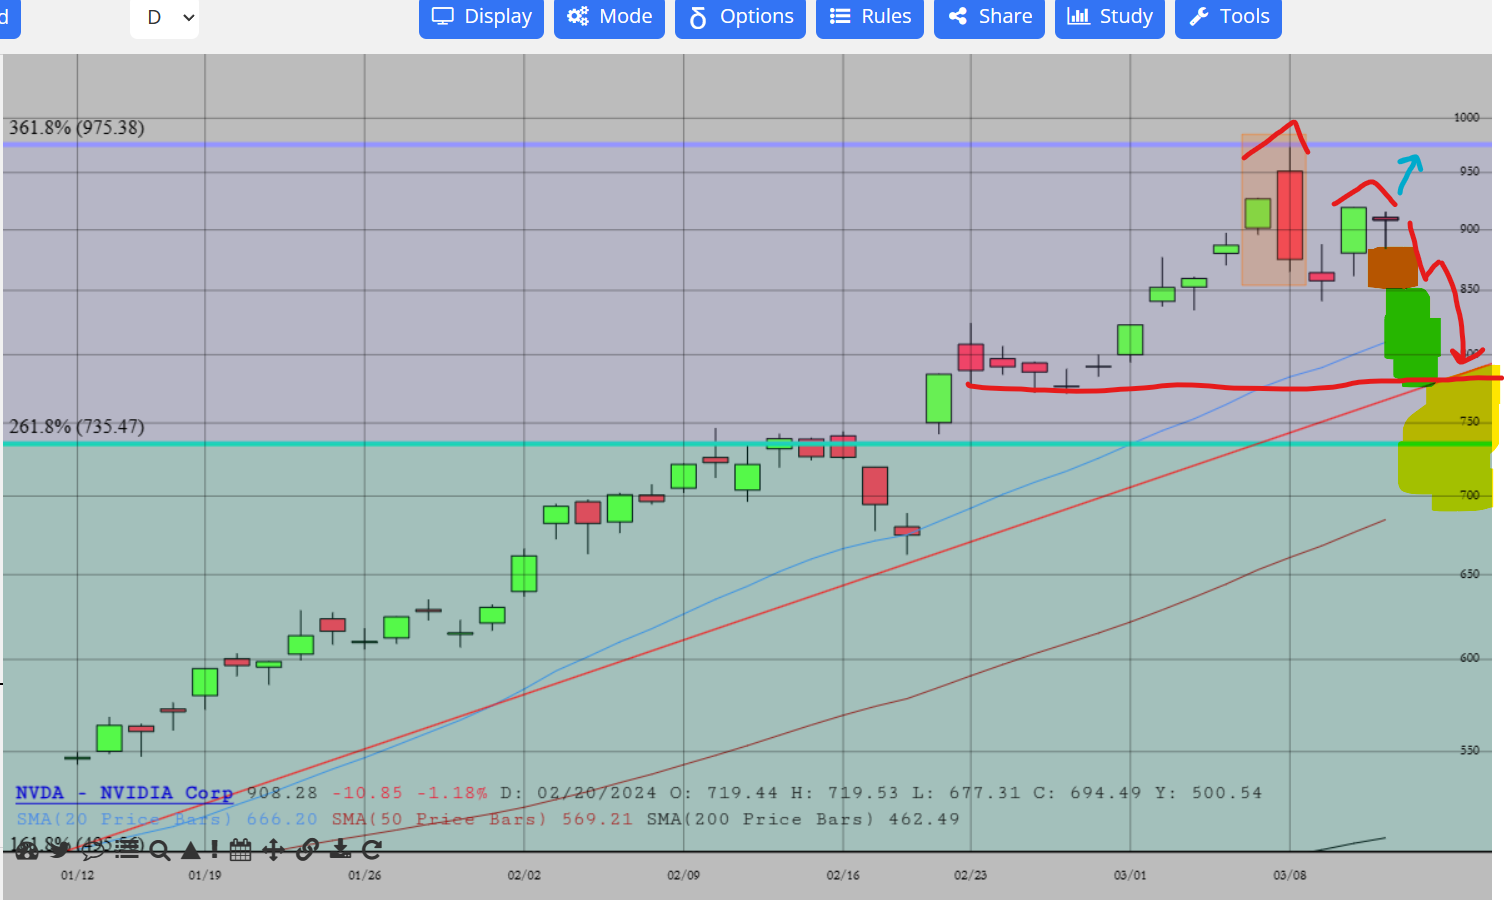
NVDA. This one simply felt good to short near the short-term tippy top. It is kind of rare for those to work out, but this thing is so long in the tooth with the bulls just blathering away about $1k, stock splits, promises of handjobs to new investors (ok, I made that last one up). It just came together quite nicely to see that big red bar take shape. Now is the hard part. For short-term traders, there have been some supportive spots and patterns that are certainly tradeable intraday.
The Nvidiots won’t stop. But what is really interesting is that what should have been a blast off pattern yesterday (as well as with the overnight action) this would normally have been shooting up to new highs again today. But no, this still managed to trade down. The Fibonacci levels are working surprisingly well on this (I didn’t want to overload the picture with too many studies, so I don’t show additional Fibonacci range from 662 to 975, but throw it up and see some interesting action at the fib levels).
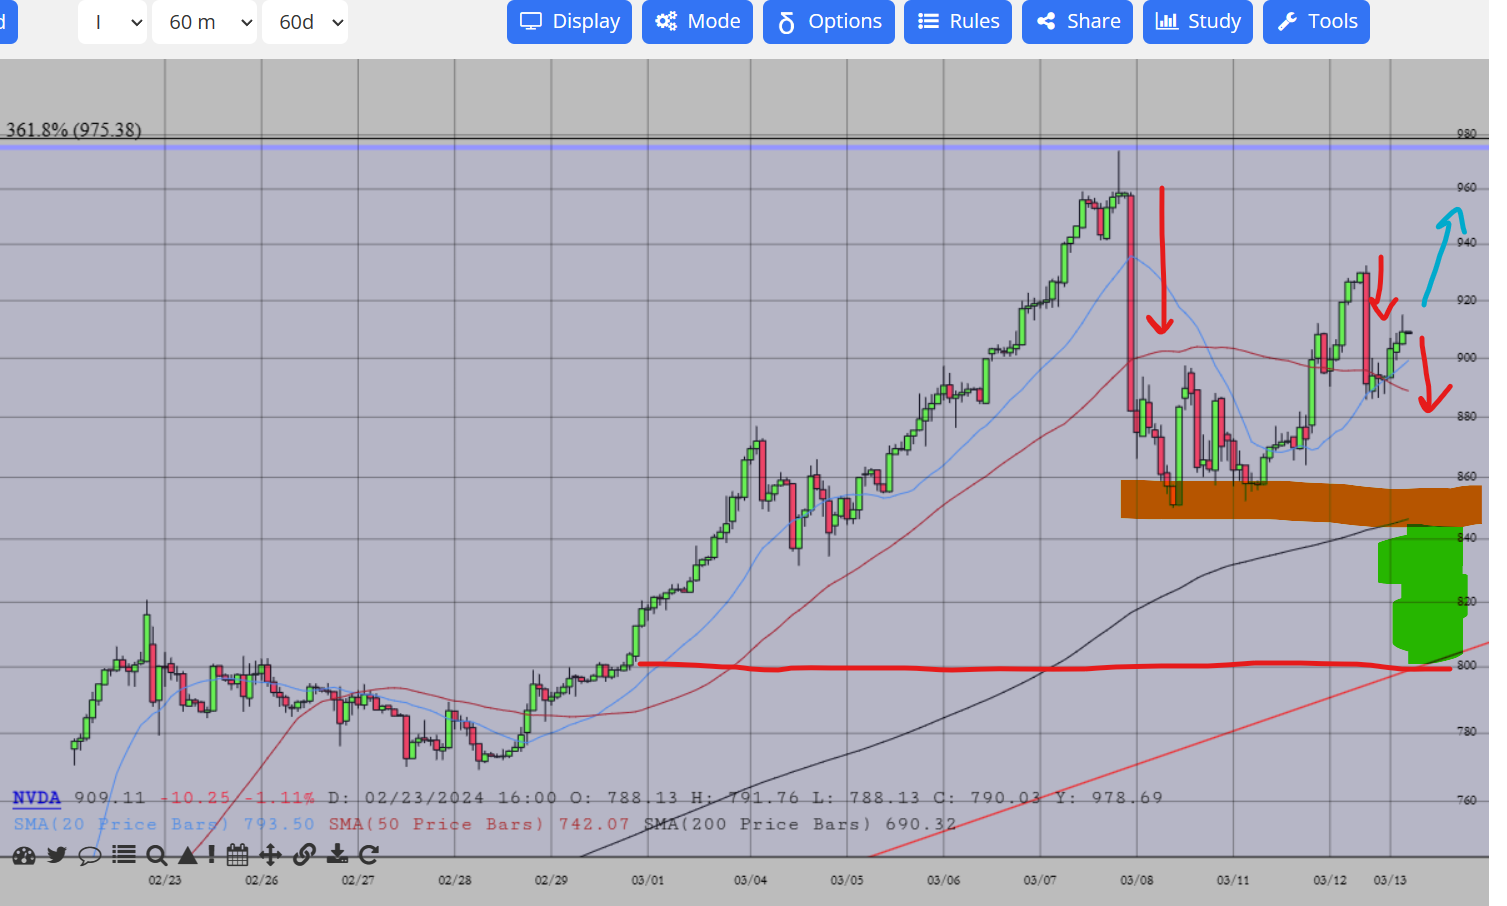
Now, it is incredibly difficult to short tops when this is literally coming off one of the strongest stock runs of the year. In fact, it is continuing to attempt a bullish run off the short-term moving averages on the 15-minute and hourly chart. However, today’s push down gives me some hope. If this works out we are seeing a lower high and could potentially see some short-term support failure. The support zones I am referring to are 850 (orange tinted zone) and 780 (green tinted zone). For the sake of providing some bear porn, I even highlighted the yellow zone because a break beneath 780 would be a big bearish short-term signal. However, that is more of a long-shot.
In the meantime, retesting 850 is very possible. If, however, this can’t hold down, then of course, this is heading back to highs. I am still holding short, but the high of this range at this Fibonacci extension level can still hold. I’ll play the hand I am dealt if this moves up.
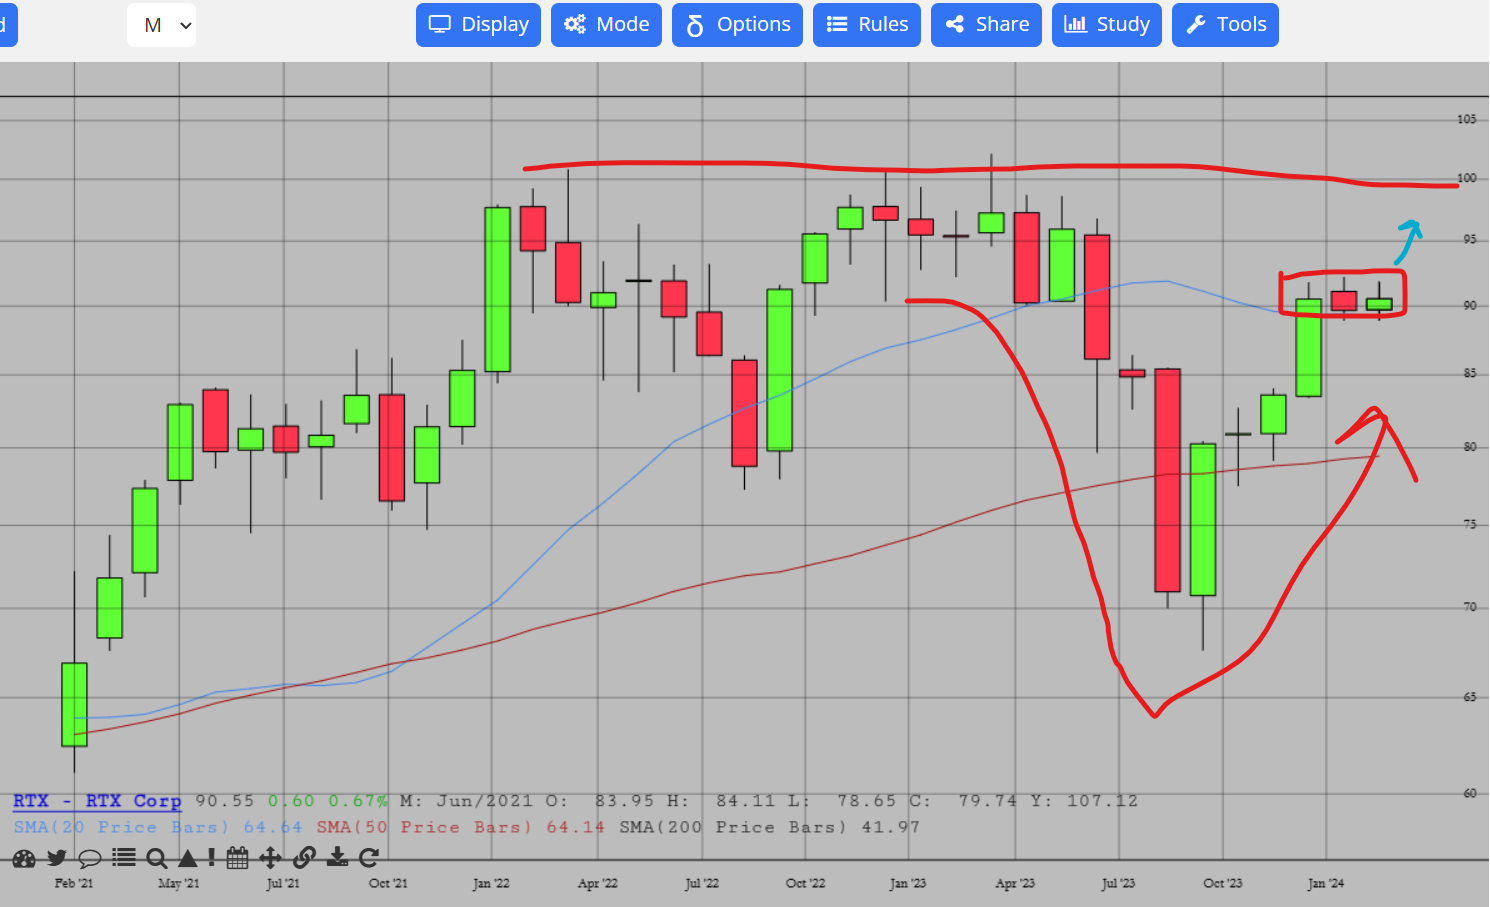
RTX. This is one for my investment account. It is boring and slow and bullishly set up. It had some bearish movement with a 6-month swoon between January and July 2023. Now it has made back up all that lost price and is consolidating above the 20 month Moving Average. I think this has a shot at pushing up to test those all-time highs around 100, if not surpass them. I’d put a short-term stop right underneath this consolidation.
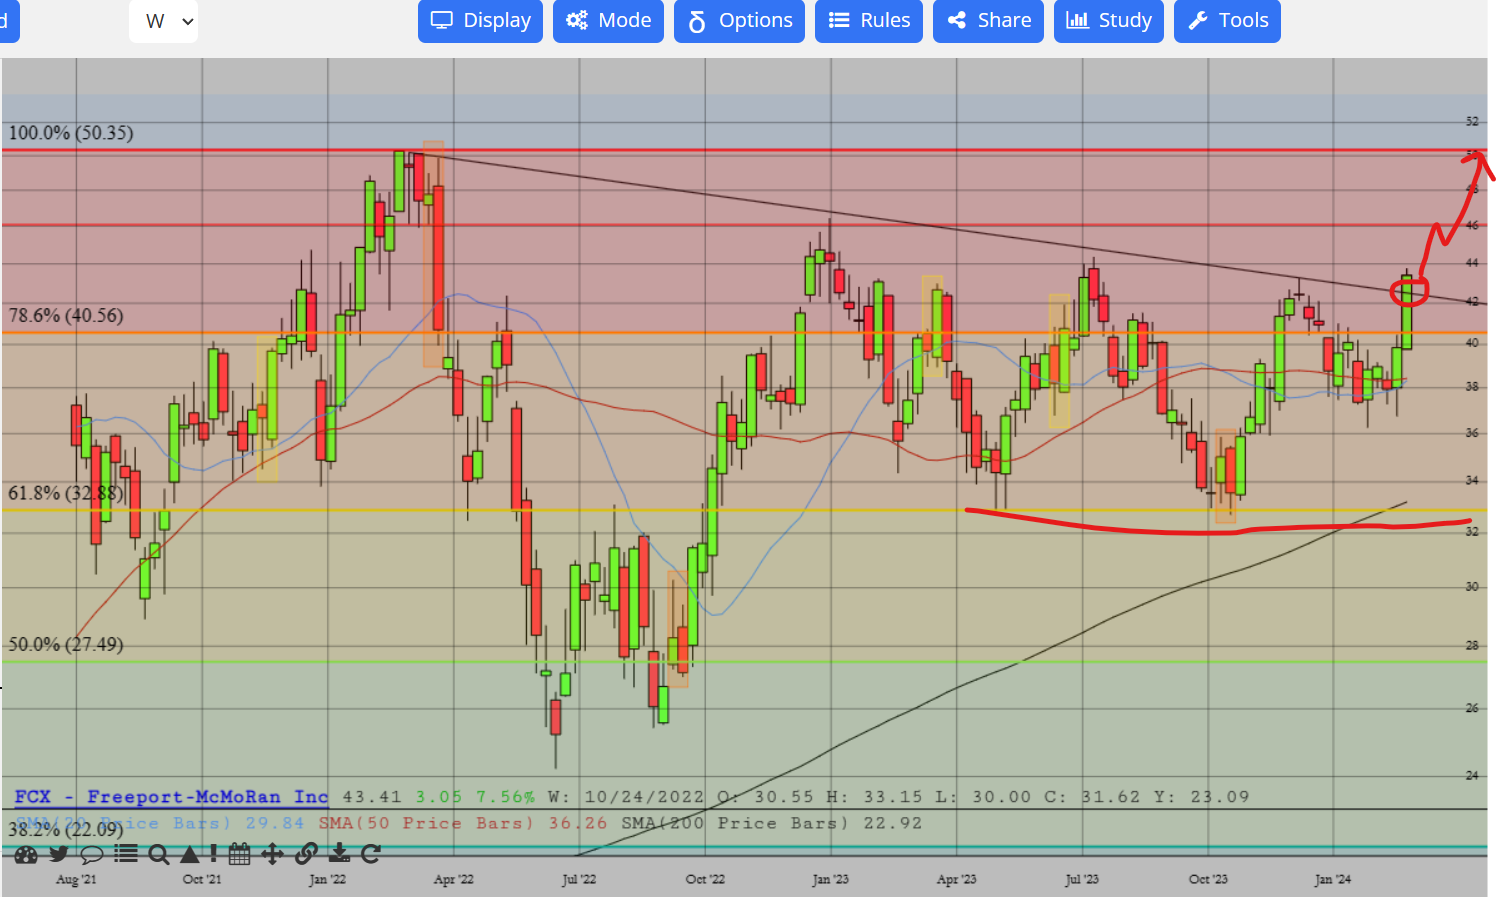
FCX. Another long and boring one. Nice bullish action and break above descending trendline. First test is at $46, so one could ride up a short-term long to there. For more of a medium-term hold, I’d get some long now but wait to see some pullback/sideways action after the first test of $46 to see where it stabilizes and then work on getting long.
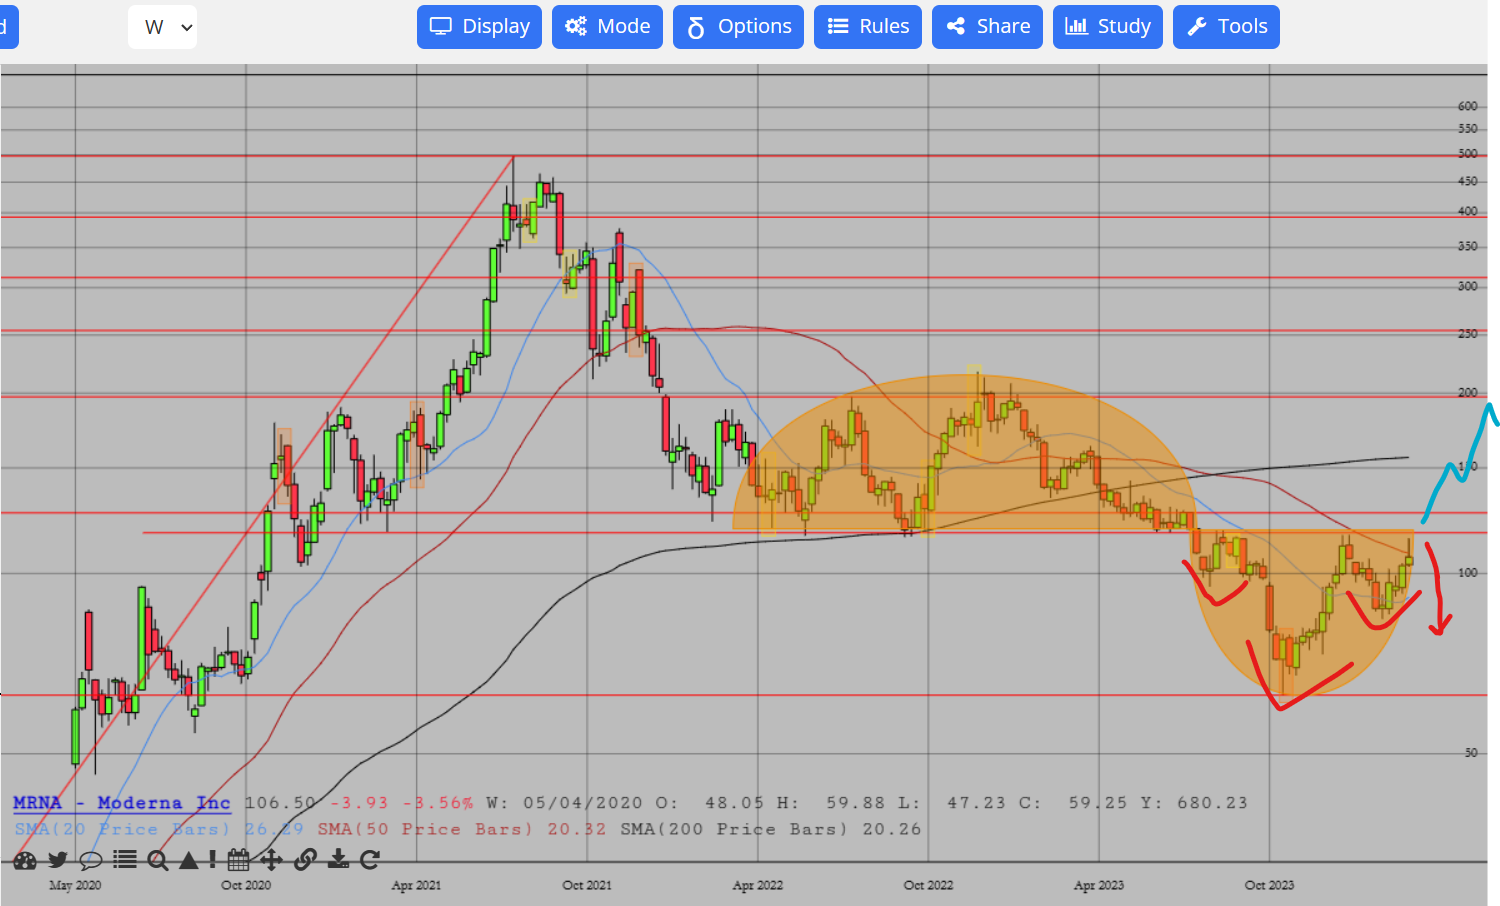
MRNA. Another oldie but goody. I mentioned this would pull back from 116 on the first retest from underneath, which was worth a nice trip down to about $85. Now it is back up retesting that zone. The weekly looks like it has potential both ways here. A breakout above $116 looks like a long-term hold as this is clearly major prior support turned resistance (as such a breakout negates that and all shorts could start to squeeze). On the other hand, this pop towards 116 is already fading and potentially turning this week into a shooting star candlestick, which could instead spell another rejection. This actually falls more in-line with the expected direction on this thing. I don’t really see anything specific on the horizon to turn this so bullishly around.
I’ll also end with this. Glad to say I am a Platinum member now. And playing around with SlopeCharts is getting fun! You can even see the differences in my screenshots between the first and last ones. Do yourself a favor and get a membership. Good luck in your trading all!
